PROVISIONAL DATA SUBJECT TO REVISION
Click to hidestation-specific text
Funding for this site is provided by:
 Site Information
LOCATION.--Lat 44°35'39.4", long
73°29'46.8" referenced to North American Datum of
1983, Clinton County, NY, Hydrologic Unit 04150408, on left
bank at upstream side of bridge on Fuller Road, 2.8 mi
southwest of Valcour, and 2.9 mi upstream from mouth.
DRAINAGE AREA.--67.8 mi².
PERIOD OF RECORD.--Occasional low-flow measurements, water years 1956-1961, 1966, 1973-1974. October 1991 to current year.
GAGE.--Water-stage recorder and crest-stage gage. Datum of gage is 235.28 ft above NAVD of 1988.
REMARKS.--Water Years 2014-23: Records fair except those for estimated daily discharges, which are poor.
EXTREMES FOR PERIOD OF RECORD.--Maximum discharge, 7,210 ft³/s, June 27, 1998, gage height, 13.78 ft, outside gage height was about 14.6 ft, from floodmark, from rating curve extended above 3,300 ft³/s on basis of contracted-opening measurement of peak flow at site 0.4 mi upstream; minimum discharge, 1.4 ft³/s, July 23, 1999; minimum gage height, 0.92 ft, Sept. 5, 2002.
 WaterAlert – get an
email or text (SMS) alert based on your chosen threshold.
WaterAlert – get an
email or text (SMS) alert based on your chosen threshold.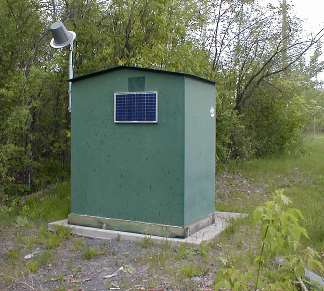 Station image
Summary of all available data for this site
Instantaneous-data availability statement

