USGS 05315000 REDWOOD RIVER NEAR MARSHALL, MN

PROVISIONAL DATA SUBJECT TO REVISION

Click to hidestation-specific text

City of Marshall Logo USGS Visual Identifier

Operated in cooperation with the City of Marshall with USGS Federal Priority Streamgage Program funding.

Links to additional gage information:

  • National Weather Service Logo National Weather Service Forecast Page

  • USGS WaterWatch's "Site Dashboard" provides seasonal and other context-oriented information about current and historical streamflow.
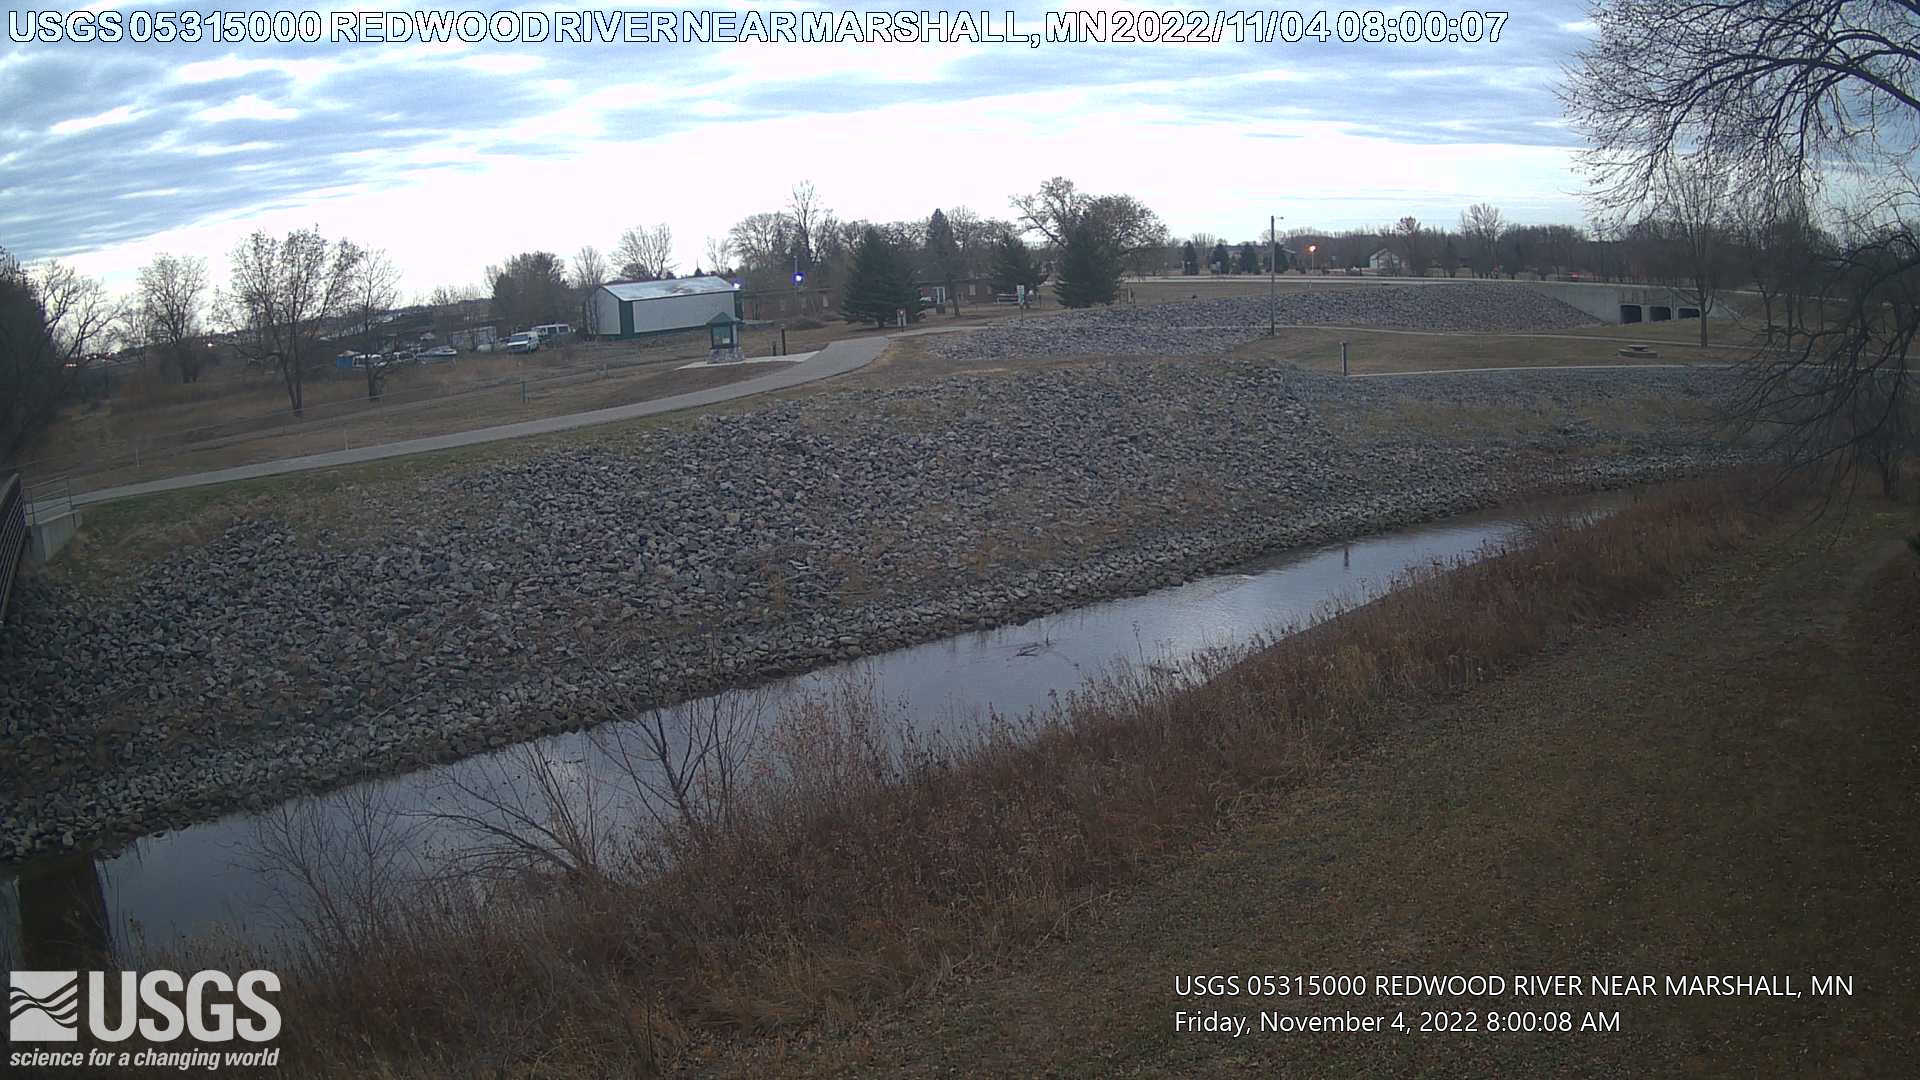
  • Recent Webcam Images:

    Webcam images will help USGS staff know when backwater from ice may be affecting discharge and when flood flows are flowing into the Cottonwood River Diversion. Click on the static or time-lapse images below to download or view larger versions from the Storm Summary Time Lapse web page.

    
Most recent photo of creek

    Time-lapse videos are considered proof of concept with no guarantee of up time. Videos can be viewed using Chrome, Firefox or Opera browser applications on smartphone, tablet, and computer devices. Additional browser support for Safari and Internet Explorer may be added later.

    Any use of trade, firm, or product names is for descriptive purposes only and does not imply endorsement by the U.S. Government.


This station managed by the Mounds View Field Office.

Available Parameters Available Period
  
1995-10-01  2024-04-18
2011-08-31  2024-04-18
2021-04-18  2024-04-18


 (7)
 

  -- or --


Summary of all available data for this site
Instantaneous-data availability statement


Discharge, cubic feet per second

Most recent instantaneous value: 222 04-18-2024   15:00 CDT
Graph of  Discharge, cubic feet per second

Add up to 2 more sites and replot for "Discharge, cubic feet per second"

?


Create presentation-quality / stand-alone graph.   Subscribe to WaterAlert      

See this graph on the Monitoring Location Pages


Daily discharge, cubic feet per second -- statistics for Apr 18 based on 83 water years of record more
Min
(1990)
25th
percen-
tile
Median Most Recent
Instantaneous
Value Apr 18
Mean 75th
percen-
tile
Max
(2019)
5.10 34 113 222 232 303 1940


Gage height, feet

Most recent instantaneous value: 8.67 04-18-2024   15:00 CDT
Graph of  Gage height, feet

Add up to 2 more sites and replot for "Gage height, feet"

?


Create presentation-quality / stand-alone graph.   Subscribe to WaterAlert      

See this graph on the Monitoring Location Pages


Stream water level elevation above NAVD 1988, in feet

Most recent instantaneous value: 1182.51 04-18-2024   15:00 CDT
Graph of  Stream water level elevation above NAVD 1988, in feet

Add up to 2 more sites and replot for "Stream water level elevation above NAVD 1988, in feet"

?


Create presentation-quality / stand-alone graph.   Subscribe to WaterAlert      

See this graph on the Monitoring Location Pages