Turbidity, water, unfiltered, monochrome near infra-red LED light, 780-900 nm, detection angle 90 +-2.5 degrees, formazin nephelometric units (FNU), QW MONITOR
-- Data temporarily unavailable for the time period specified --
Suspended solids, water, unfiltered, estimated by regression equation, milligrams per liter, QW MONITOR, [TSS by regression]
-- Data temporarily unavailable for the time period specified --
Suspended solids, water, unfiltered, estimated by regression equation, milligrams per liter, QW MONITOR, [TSS lower prediction interval]
-- Data temporarily unavailable for the time period specified --
Suspended solids, water, unfiltered, estimated by regression equation, milligrams per liter, QW MONITOR, [TSS upper prediction interval]
-- Data temporarily unavailable for the time period specified --
Escherichia coli, estimated by regression equation, water, colonies per 100 milliliters, QW MONITOR, [E. coli by regression]
-- Data temporarily unavailable for the time period specified --
Escherichia coli, estimated by regression equation, water, colonies per 100 milliliters, QW MONITOR, [E.coli lower prediction period]
-- Data temporarily unavailable for the time period specified --
Escherichia coli, estimated by regression equation, water, colonies per 100 milliliters, QW MONITOR, [E.coli upper prediction period]
-- Data temporarily unavailable for the time period specified --
Phosphorus, water, unfiltered, estimated by regression equation, milligrams per liter as phosphorus, QW MONITOR, [TP by regression]
-- Data temporarily unavailable for the time period specified --
Phosphorus, water, unfiltered, estimated by regression equation, milligrams per liter as phosphorus, QW MONITOR, [TP lower prediction interval]
-- Data temporarily unavailable for the time period specified --
Phosphorus, water, unfiltered, estimated by regression equation, milligrams per liter as phosphorus, QW MONITOR, [TP upper prediction interval]
-- Data temporarily unavailable for the time period specified --
Total nitrogen [nitrate + nitrite + ammonia + organic-N], water, unfiltered, estimated by regression equation, milligrams per liter as nitrogen, QW MONITOR, [TN by regression]
-- Data temporarily unavailable for the time period specified --
Total nitrogen [nitrate + nitrite + ammonia + organic-N], water, unfiltered, estimated by regression equation, milligrams per liter as nitrogen, QW MONITOR, [TN lower prediction interval]
-- Data temporarily unavailable for the time period specified --
Total nitrogen [nitrate + nitrite + ammonia + organic-N], water, unfiltered, estimated by regression equation, milligrams per liter as nitrogen, QW MONITOR, [TN upper prediction interval]
-- Data temporarily unavailable for the time period specified --


 WaterNow – get the latest
gage data from your mobile phone or email.
WaterNow – get the latest
gage data from your mobile phone or email.
![Graph of Discharge, cubic feet per second, [Discharge from Primary Sensor]](https://nadww01.er.usgs.gov/nwisweb/data/img/USGS.06784000.94576.00060..20250628.20250705.log.0.p50.gif)
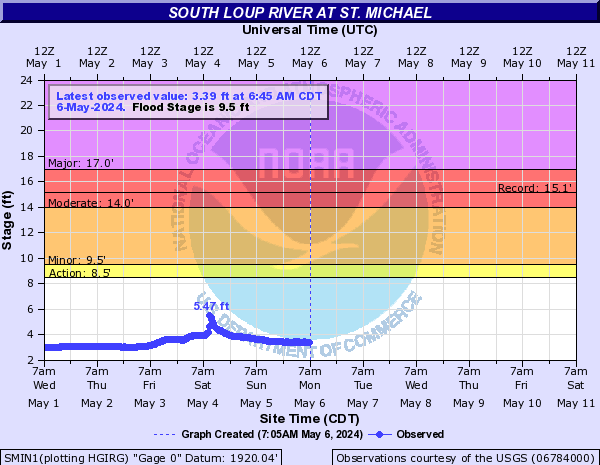
![Graph of Gage height, feet, [Primary Stage Sensor]](https://nadww01.er.usgs.gov/nwisweb/data/img/USGS.06784000.94575.00065..20250628.20250705..0..gif)
