USGS 01302020 BRONX RIVER AT NY BOTANICAL GARDEN AT BRONX NY

PROVISIONAL DATA SUBJECT TO REVISION

Click to hidestation-specific text


> Site Information
LOCATION.--Lat 40°51'44.3", long 73°52'27.8" referenced to North American Datum of 1983, Bronx County, NY, Hydrologic Unit 02030102, on left bank at New York Botanical Garden in Bronx.
DRAINAGE AREA.--38.4 mi². not including 12.7 mi², from which the entire flow is diverted for municipal water supply.
PERIOD OF RECORD.--August 2006 to current year.
GAGE.--Water-stage recorder. Datum of gage is 49.86 ft above NAVD of 1988.
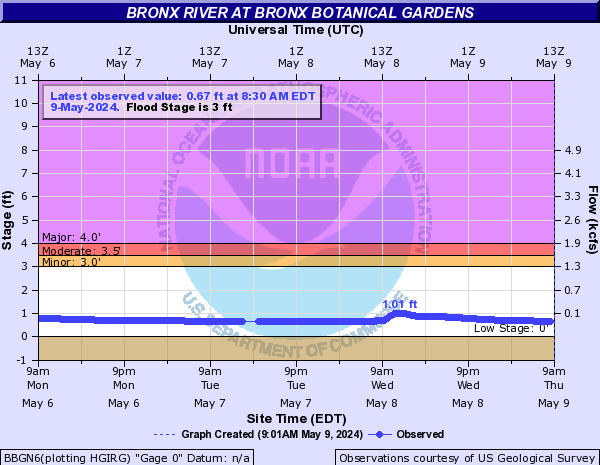
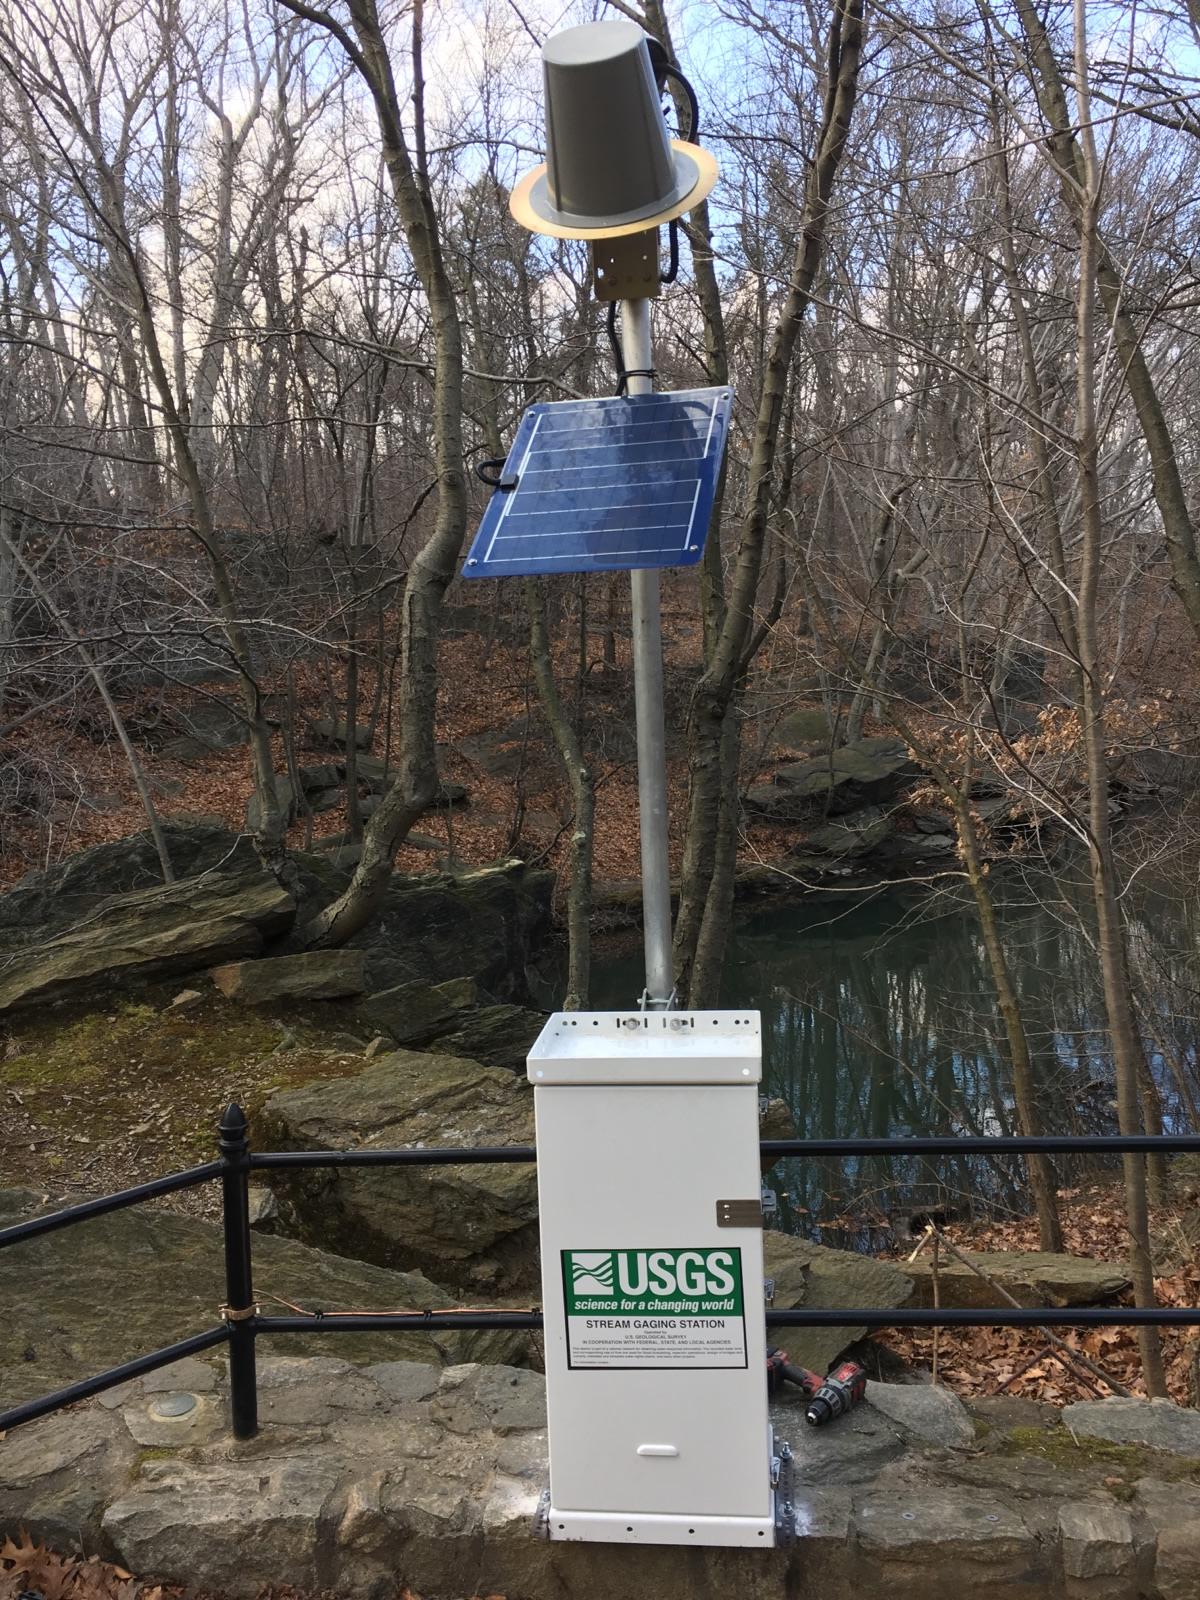
REMARKS.--Entire flow, runoff from 12.7 mi², diverted from Kensico Reservoir for water supply of City of New York and entire flow, runoff from 0.68 mi², except for periods of spill, diverted from White Plains Reservoirs 1 and 2 for water supply of City of White Plains. Satellite gage-height telemeter at station.
Water Years 2014-23: Records fair.
EXTREMES FOR PERIOD OF RECORD.--Maximum discharge, 3,460 ft³/s, Apr. 16, 2007, gage height, 6.05 ft; minimum discharge, 7.1 ft³/s, Oct. 11, 12, 2017; minimum gage height, 0.45 ft, July 6, 2017.
> Rating Information
This station managed by the NY Water Science Center Milford.

Available Parameters Available Period
  
2021-06-28  2024-11-21
2007-10-01  2024-11-21
2007-10-01  2024-11-21
2021-06-28  2024-11-19
2021-06-28  2024-11-21
2021-06-28  2024-11-21
2021-06-28  2024-11-21
2021-06-28  2024-11-19


 (7)
 

  -- or --


Summary of all available data for this site
Instantaneous-data availability statement


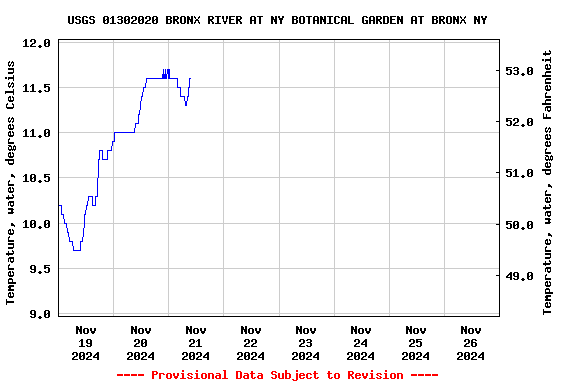
Temperature, water, degrees Celsius

Most recent instantaneous value: 11.6 11-21-2024   09:30 EST
Graph of  Temperature, water, degrees Celsius

Add up to 2 more sites and replot for "Temperature, water, degrees Celsius"

?


Create presentation-quality / stand-alone graph.   Subscribe to WaterAlert      

See this graph on the Monitoring Location Pages


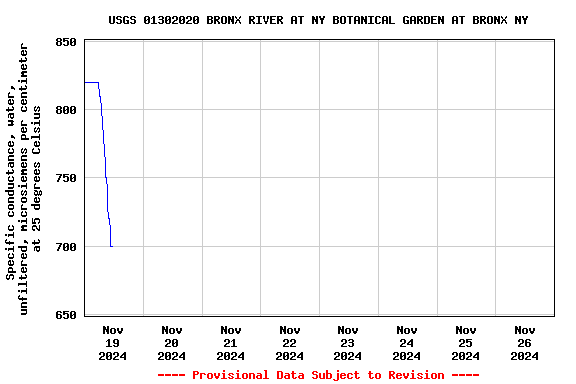
Specific conductance, water, unfiltered, microsiemens per centimeter at 25 degrees Celsius

Most recent instantaneous value: 700 11-19-2024   11:15 EST
Graph of

Add up to 2 more sites and replot for "Specific conductance, water, unfiltered, microsiemens per centimeter at 25 degrees Celsius"

?


Create presentation-quality / stand-alone graph.   Subscribe to WaterAlert      

See this graph on the Monitoring Location Pages


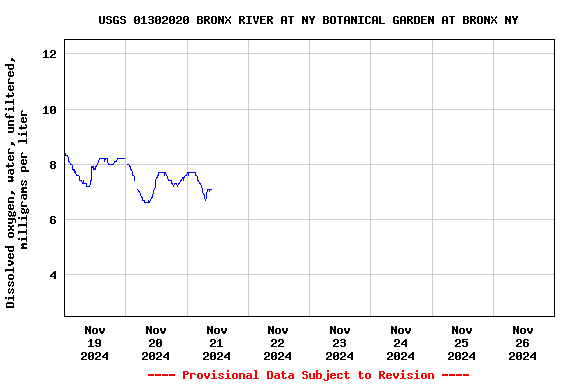
Dissolved oxygen, water, unfiltered, milligrams per liter

Most recent instantaneous value: 7.1 11-21-2024   09:30 EST
Graph of  Dissolved oxygen, water, unfiltered, milligrams per liter

Add up to 2 more sites and replot for "Dissolved oxygen, water, unfiltered, milligrams per liter"

?


Create presentation-quality / stand-alone graph.   Subscribe to WaterAlert      

See this graph on the Monitoring Location Pages


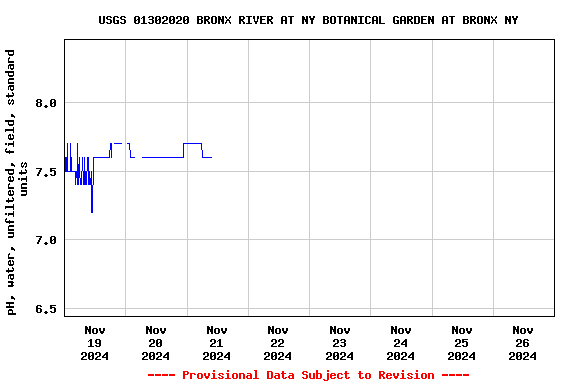
pH, water, unfiltered, field, standard units

Most recent instantaneous value: 7.6 11-21-2024   09:30 EST
Graph of  pH, water, unfiltered, field, standard units

Add up to 2 more sites and replot for "pH, water, unfiltered, field, standard units"

?


Create presentation-quality / stand-alone graph.   Subscribe to WaterAlert      

See this graph on the Monitoring Location Pages


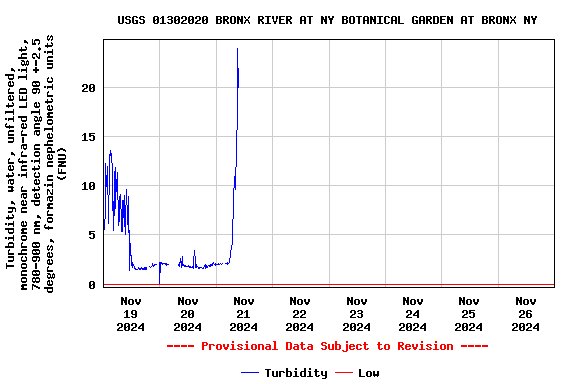
Turbidity, water, unfiltered, monochrome near infra-red LED light, 780-900 nm, detection angle 90 +-2.5 degrees, formazin nephelometric units (FNU)

Most recent instantaneous value: 20.0 11-21-2024   09:30 EST
Graph of  Turbidity, water, unfiltered, monochrome near infra-red LED light, 780-900 nm, detection angle 90 +-2.5 degrees, formazin nephelometric units (FNU)

Add up to 2 more sites and replot for "Turbidity, water, unfiltered, monochrome near infra-red LED light, 780-900 nm, detection angle 90 +-2.5 degrees, formazin nephelometric units (FNU)"

?


Create presentation-quality / stand-alone graph.   Subscribe to WaterAlert      

See this graph on the Monitoring Location Pages


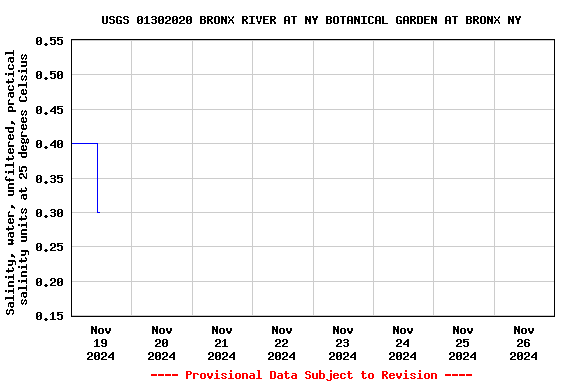
Salinity, water, unfiltered, practical salinity units at 25 degrees Celsius

Most recent instantaneous value: 0.3 11-19-2024   11:15 EST
Graph of  Salinity, water, unfiltered, practical salinity units at 25 degrees Celsius

Add up to 2 more sites and replot for "Salinity, water, unfiltered, practical salinity units at 25 degrees Celsius"

?


Create presentation-quality / stand-alone graph.   Subscribe to WaterAlert      

See this graph on the Monitoring Location Pages