PROVISIONAL DATA SUBJECT TO REVISION
Click to hidestation-specific text
Funding for this site is provided by:
 Site Information
LOCATION.--Lat 43°45'23.4", long
74°16'01.4" referenced to North American Datum of
1983, Hamilton County, NY, Hydrologic Unit 02020001, on right
bank 0.8 mi downstream from Indian Lake Dam, 1.0 mi upstream
from Big Brook, and 2.0 mi south of village of Indian
Lake.
DRAINAGE AREA.--132 mi².
PERIOD OF RECORD.--July 1912 to June 1914, June 1915 to September 1915 (monthly discharges only, published in WSP 1302), October 1915 to current year.
REVISIONS HISTORY.--WDR NY-94-1: 1993.
GAGE.--Water-stage recorder. Datum of gage is 1,604.23 ft above NGVD of 1929 and 1,603.94 ft above NAVD of 1988. Prior to Aug. 30, 1916, nonrecording gage at same site and datum.
REMARKS.--Flow regulated by Indian Lake (station 01314500).
Water Years 2014-24: Records good.
EXTREMES FOR PERIOD OF RECORD.--Maximum discharge, 3,520 ft³/s, Apr. 29, 2011, gage height, 7.83 ft; minimum discharge, has been less than 1.0 ft³/s, at times when entire flow of river is stored in Indian Lake.
 WaterAlert – get an
email or text (SMS) alert based on your chosen threshold.
WaterAlert – get an
email or text (SMS) alert based on your chosen threshold.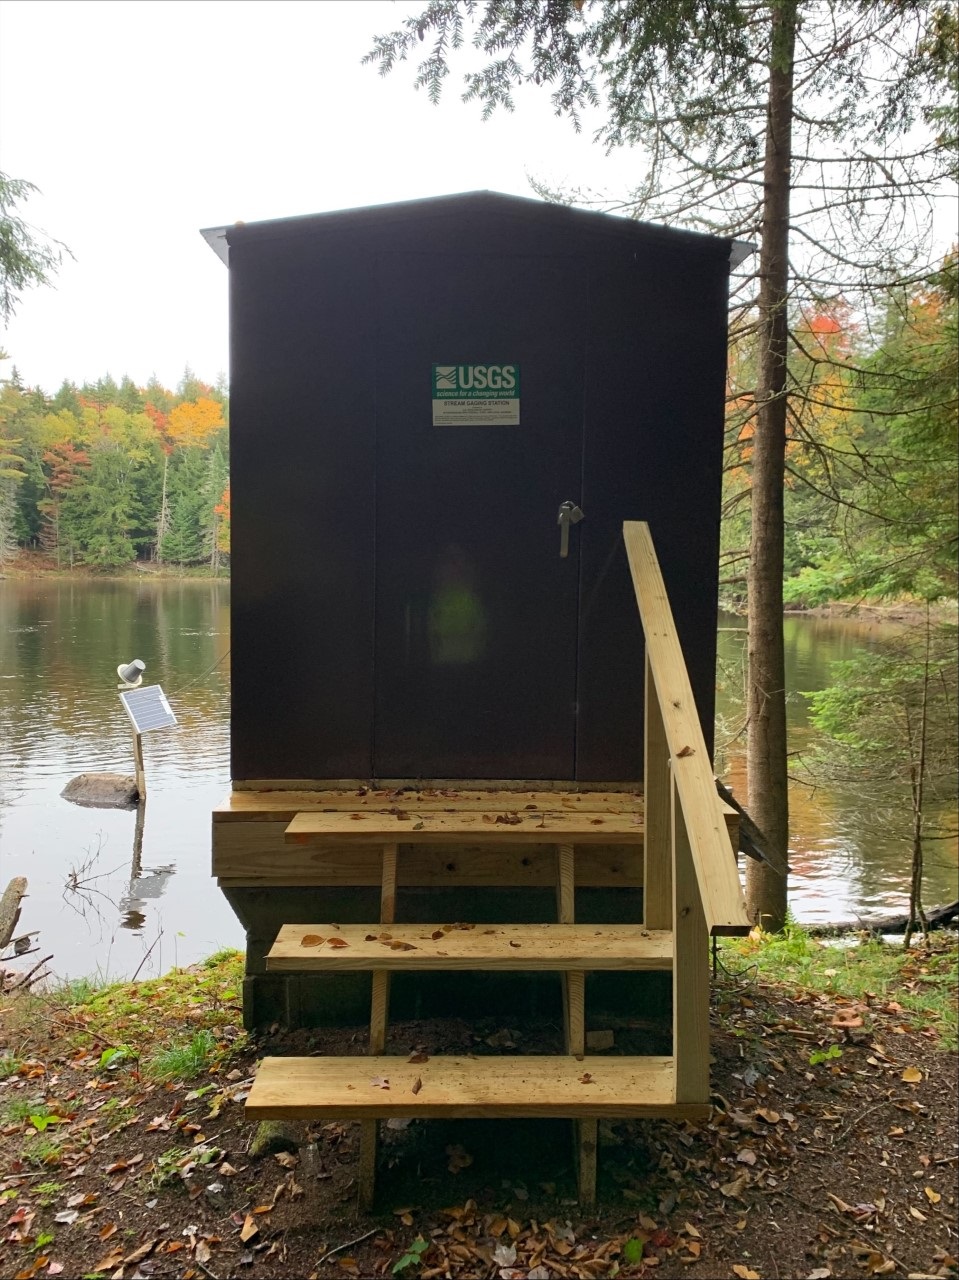 Station image
Summary of all available data for this site
Instantaneous-data availability statement

