PROVISIONAL DATA SUBJECT TO REVISION
Click to hidestation-specific text
Funding for this site is provided by:
 Site Information
LOCATION.--Lat 42°02'48", long
74°16'38" referenced to North American Datum of 1927,
Ulster County, NY, Hydrologic Unit 02020006, at bridge on
County Highway 40, about 500 ft upstream from Esopus Creek, at
Mount Tremper.
DRAINAGE AREA.--25 mi².
PERIOD OF RECORD.--Miscellaneous measurements--1954, 2010. October 2010 to current year.
GAGE.--Water-stage recorder. Elevation of gage is 700 ft above NAVD of 1988, from topographic map.
REMARKS.--Water Years 2014-24: Records poor.
EXTREMES FOR PERIOD OF RECORD.--Maximum discharge, 12,600 ft³/s, Aug. 28, 2011, gage height, 15.15 ft, but may have been higher during period of missing data on that day; minimum discharge undetermined.
PERIOD OF RECORD1.--November 2010 to current year.
PERIOD OF DAILY RECORD1.--TURBIDITY: DTS12 - November 2010 to September 2011, October 2012 to current year. Analite - August 2022 to current year.
SUSPENDED-SEDIMENT CONCENTRATION: November 2010 to September 2011, October 2012 to current year.
SUSPENDED-SEDIMENT DISCHARGE: October 2012 to current year.
INSTRUMENTATION1.--An optical turbidity sensor provides readings at 15-minute intervals since November 2010.
REMARKS1.--Turbidity data are collected every 15 minutes using an in-situ turbidity probe located in a 2-inch diameter galvanized steel pipe extending 10 ft from the left bank. Daily suspended-sediment load and concentration are derived from a regression equation relating turbidity to suspended-sediment concentration.
COOPERATION1.--In cooperation with the New York City Department of Environmental Protection.
EXTREMES FOR PERIOD OF DAILY RECORD1.--TURBIDITY: DTS12 - Maximum, 1,980 FNU, Feb. 25, 2016; minimum, <0.2 FNU, on many days. Analite - Maximum, 1,380 FNU, Aug. 30, 2023; minimum, <0.2FNU, on several days. [<, actual value is known to be less than the value shown]
SUSPENDED-SEDIMENT CONCENTRATION: Maximum daily mean, 1,630 mg/L, Aug. 28, 2011; minimum daily mean, <1 mg/L, on many days in 2011, 2013-14.
SUSPENDED-SEDIMENT DISCHARGE: Maximum daily, 1,270 tons, Oct. 19, 2012; minimum daily, <0.01 tons, on many days in 2013-14.
1 Water-Quality Records
 WaterAlert – get an
email or text (SMS) alert based on your chosen threshold.
WaterAlert – get an
email or text (SMS) alert based on your chosen threshold.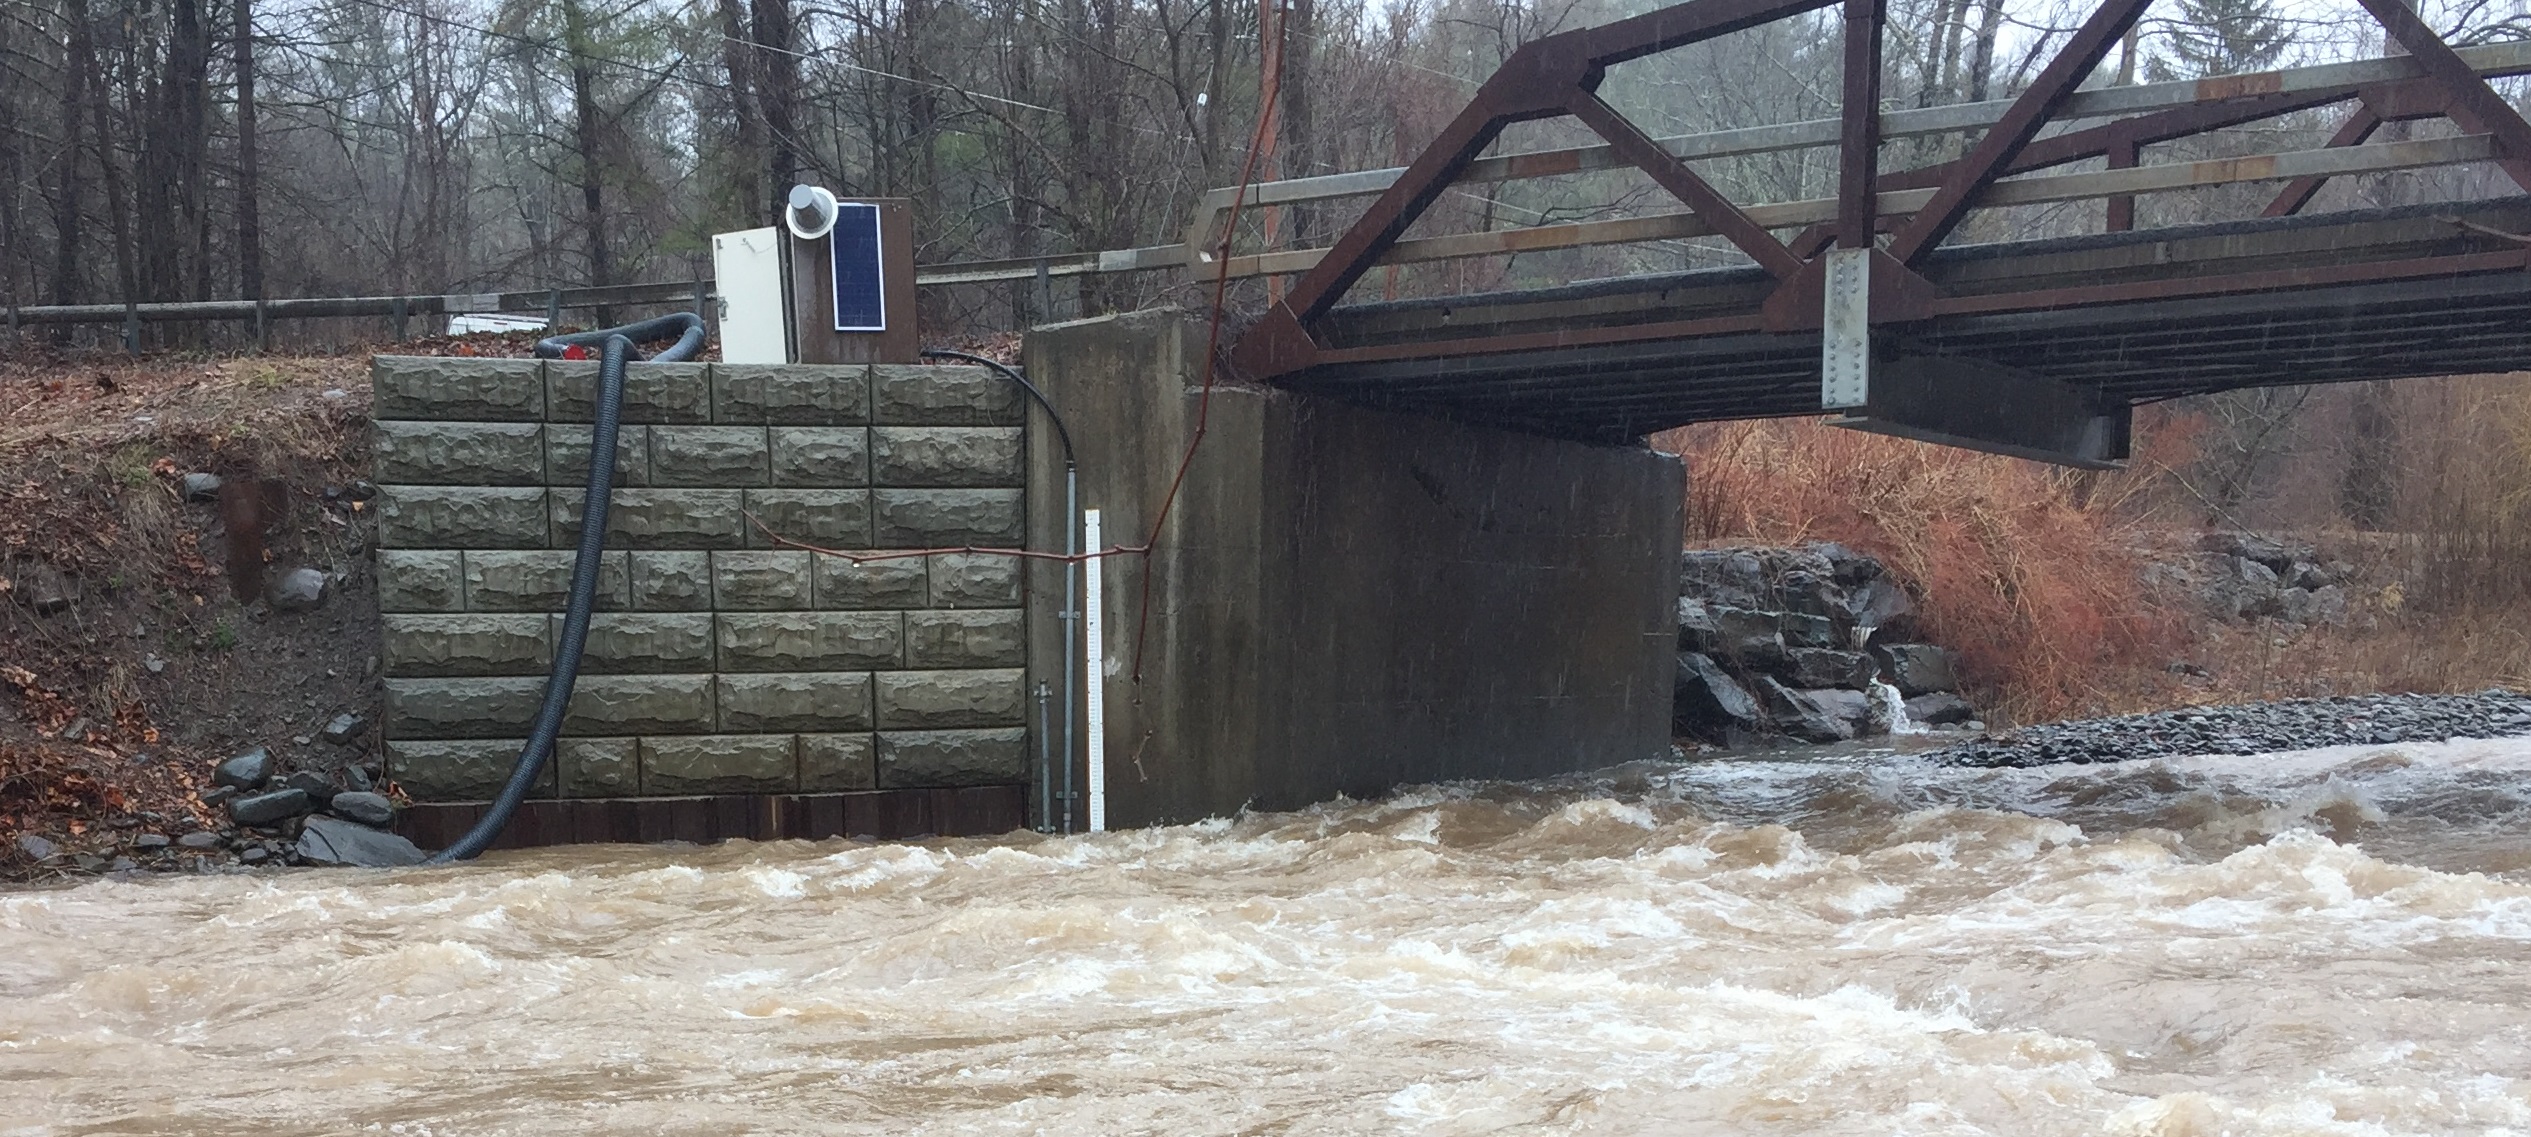 Station image
Summary of all available data for this site
Instantaneous-data availability statement

