PROVISIONAL DATA SUBJECT TO REVISION
Click to hidestation-specific text
Funding for this site is provided by:
 Site Information
LOCATION.--Lat 42°01'10", long
74°15'59" referenced to North American Datum of 1983,
Ulster County, NY, Hydrologic Unit 02020006, on right bank 950
ft upstream from State Highway 28 at Beechford, 0.3 mi above
mouth, and 1.8 mi southeast of Mount Tremper.
DRAINAGE AREA.--16.5 mi².
PERIOD OF RECORD.--October 1997 to current year.
REVISIONS HISTORY.--WDR NY-99-1: 1998. WDR NY-01-1: 1998-2000.
GAGE.--Water-stage recorder and crest-stage gage. Datum of gage is 659.04 ft above NGVD of 1929 and 658.36 ft above NAVD of 1988.
REMARKS.--Water Years 2014-24: Records fair except those for estimated daily discharges, which are poor.
EXTREMES FOR PERIOD OF RECORD.--Maximum discharge, 2,820 ft³/s, June 26, 2006, gage height, 8.71 ft; minimum discharge, 0.11 ft³/s, Sept. 8, 9, 2002; minimum gage height, 1.41 ft, Aug. 12, 13, 1999.
PERIOD OF RECORD1.--November 2010 to current year.
PERIOD OF DAILY RECORD1.--TURBIDITY: DTS12 - November 2010 to December 2014, September 2016 to current year. Analite - August 2022 to current year.
INSTRUMENTATION1.--An optical turbidity sensor provides readings at 15-minute intervals since November 2010.
COOPERATION1.--In cooperation with the New York City Department of Environmental Protection.
EXTREMES FOR PERIOD OF DAILY RECORD1.--TURBIDITY: DTS12 - Maximum, 859 FNU, Aug. 28, 2011; minimum, <0.2 FNU, on many days. Analite - Maximum, 880 FNU, Aug. 30, 2023; minimum, <0.2FNU, on several days. [<, actual value is known to be less than the value shown]
1 Water-Quality Records
 WaterAlert – get an
email or text (SMS) alert based on your chosen threshold.
WaterAlert – get an
email or text (SMS) alert based on your chosen threshold.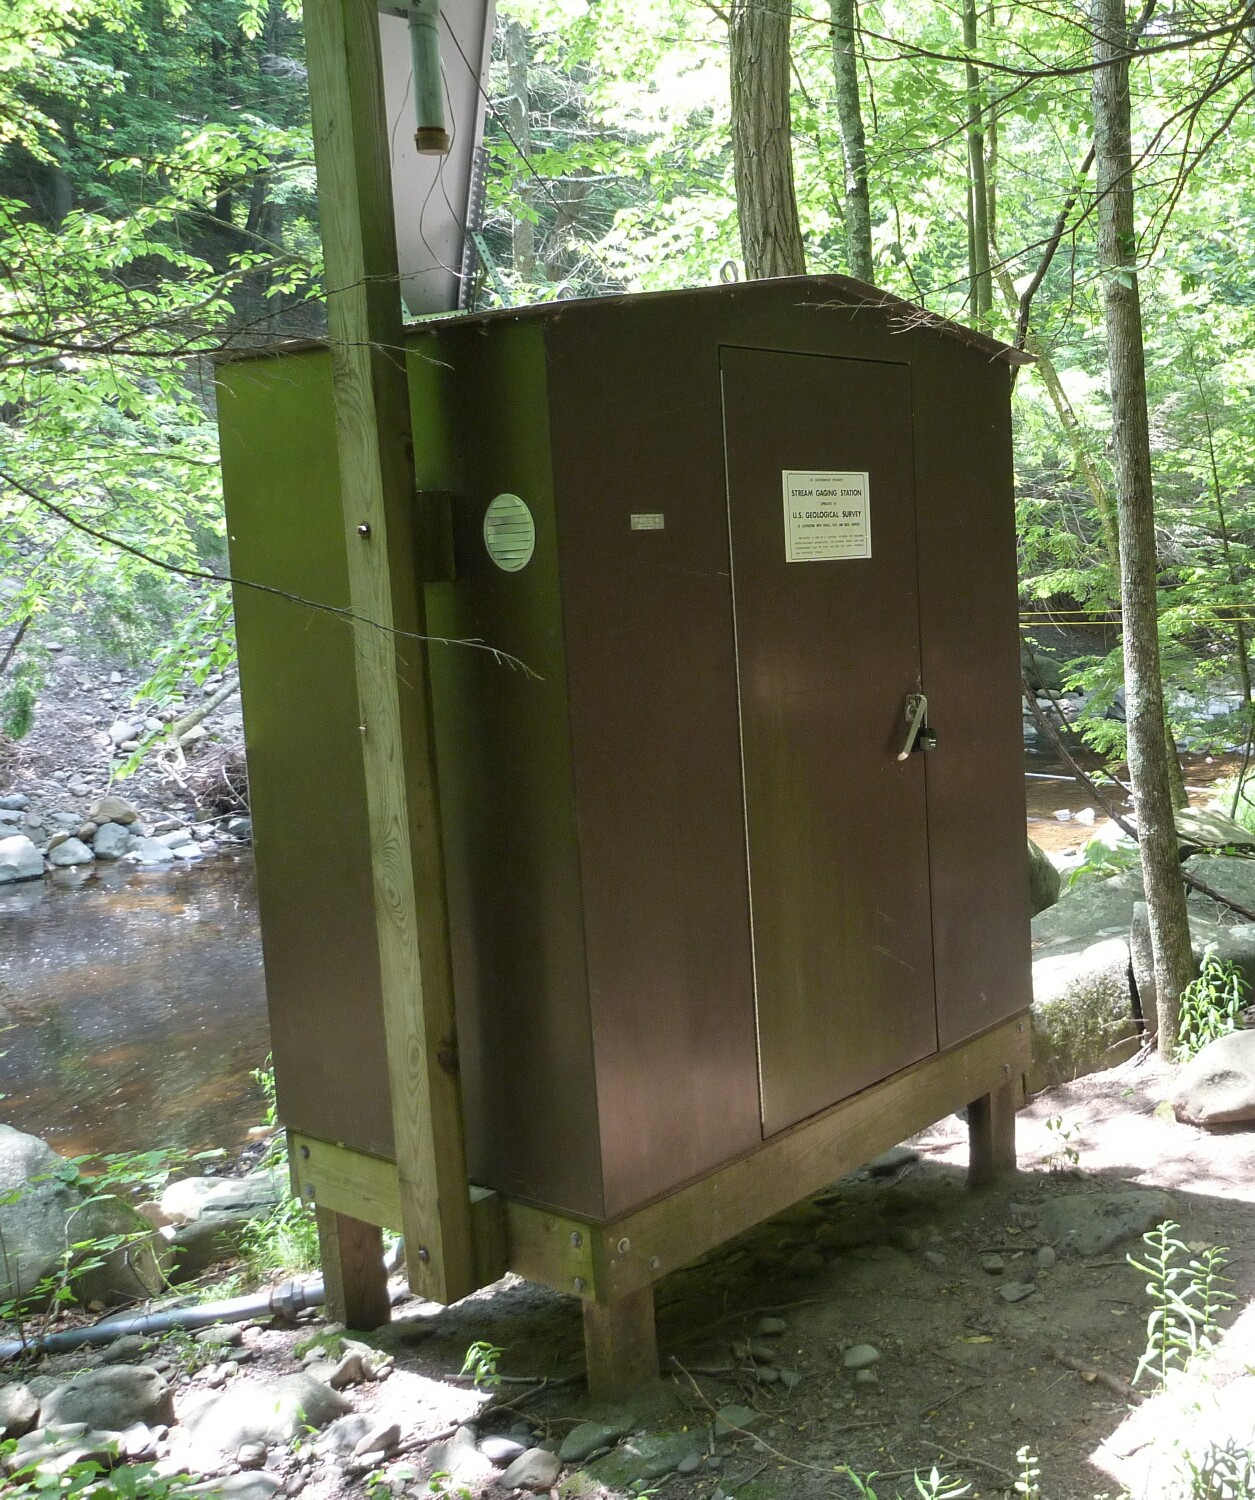 Station image
Summary of all available data for this site
Instantaneous-data availability statement

