PROVISIONAL DATA SUBJECT TO REVISION
Click to hidestation-specific text
Funding for this site is provided by:
 Site Information
LOCATION.--Lat 41°26'18.2", long
74°21'57.4" referenced to North American Datum of
1983, Orange County, NY, Hydrologic Unit 02020007,
on right bank 200 ft upstream from bridge on
Phillipsburg Road, 0.3 mi downstream from Masonic
Creek, and 0.6 mi northwest of Phillipsburg.
DRAINAGE AREA.--429 mi².
PERIOD OF RECORD.--June 2018 to current year.
GAGE.--Water-stage recorder and crest-stage gage. Datum of gage is 348.33 ft above NAVD of 1988.
REMARKS.--Water Years 2018-20, 2023-24: Records poor. Water Years 2021-22: Records fair except those for estimated daily discharges, which are poor.
EXTREMES FOR PERIOD OF RECORD.--Maximum discharge, 5,870 ft³/s, Apr. 8, 2022, gage height, 11.53 ft; minimum discharge, 22.8 ft³/s, Aug. 19, 20, 21, Sept. 4, 2022, gage height, 3.31 ft.
 WaterAlert – get an
email or text (SMS) alert based on your chosen threshold.
WaterAlert – get an
email or text (SMS) alert based on your chosen threshold.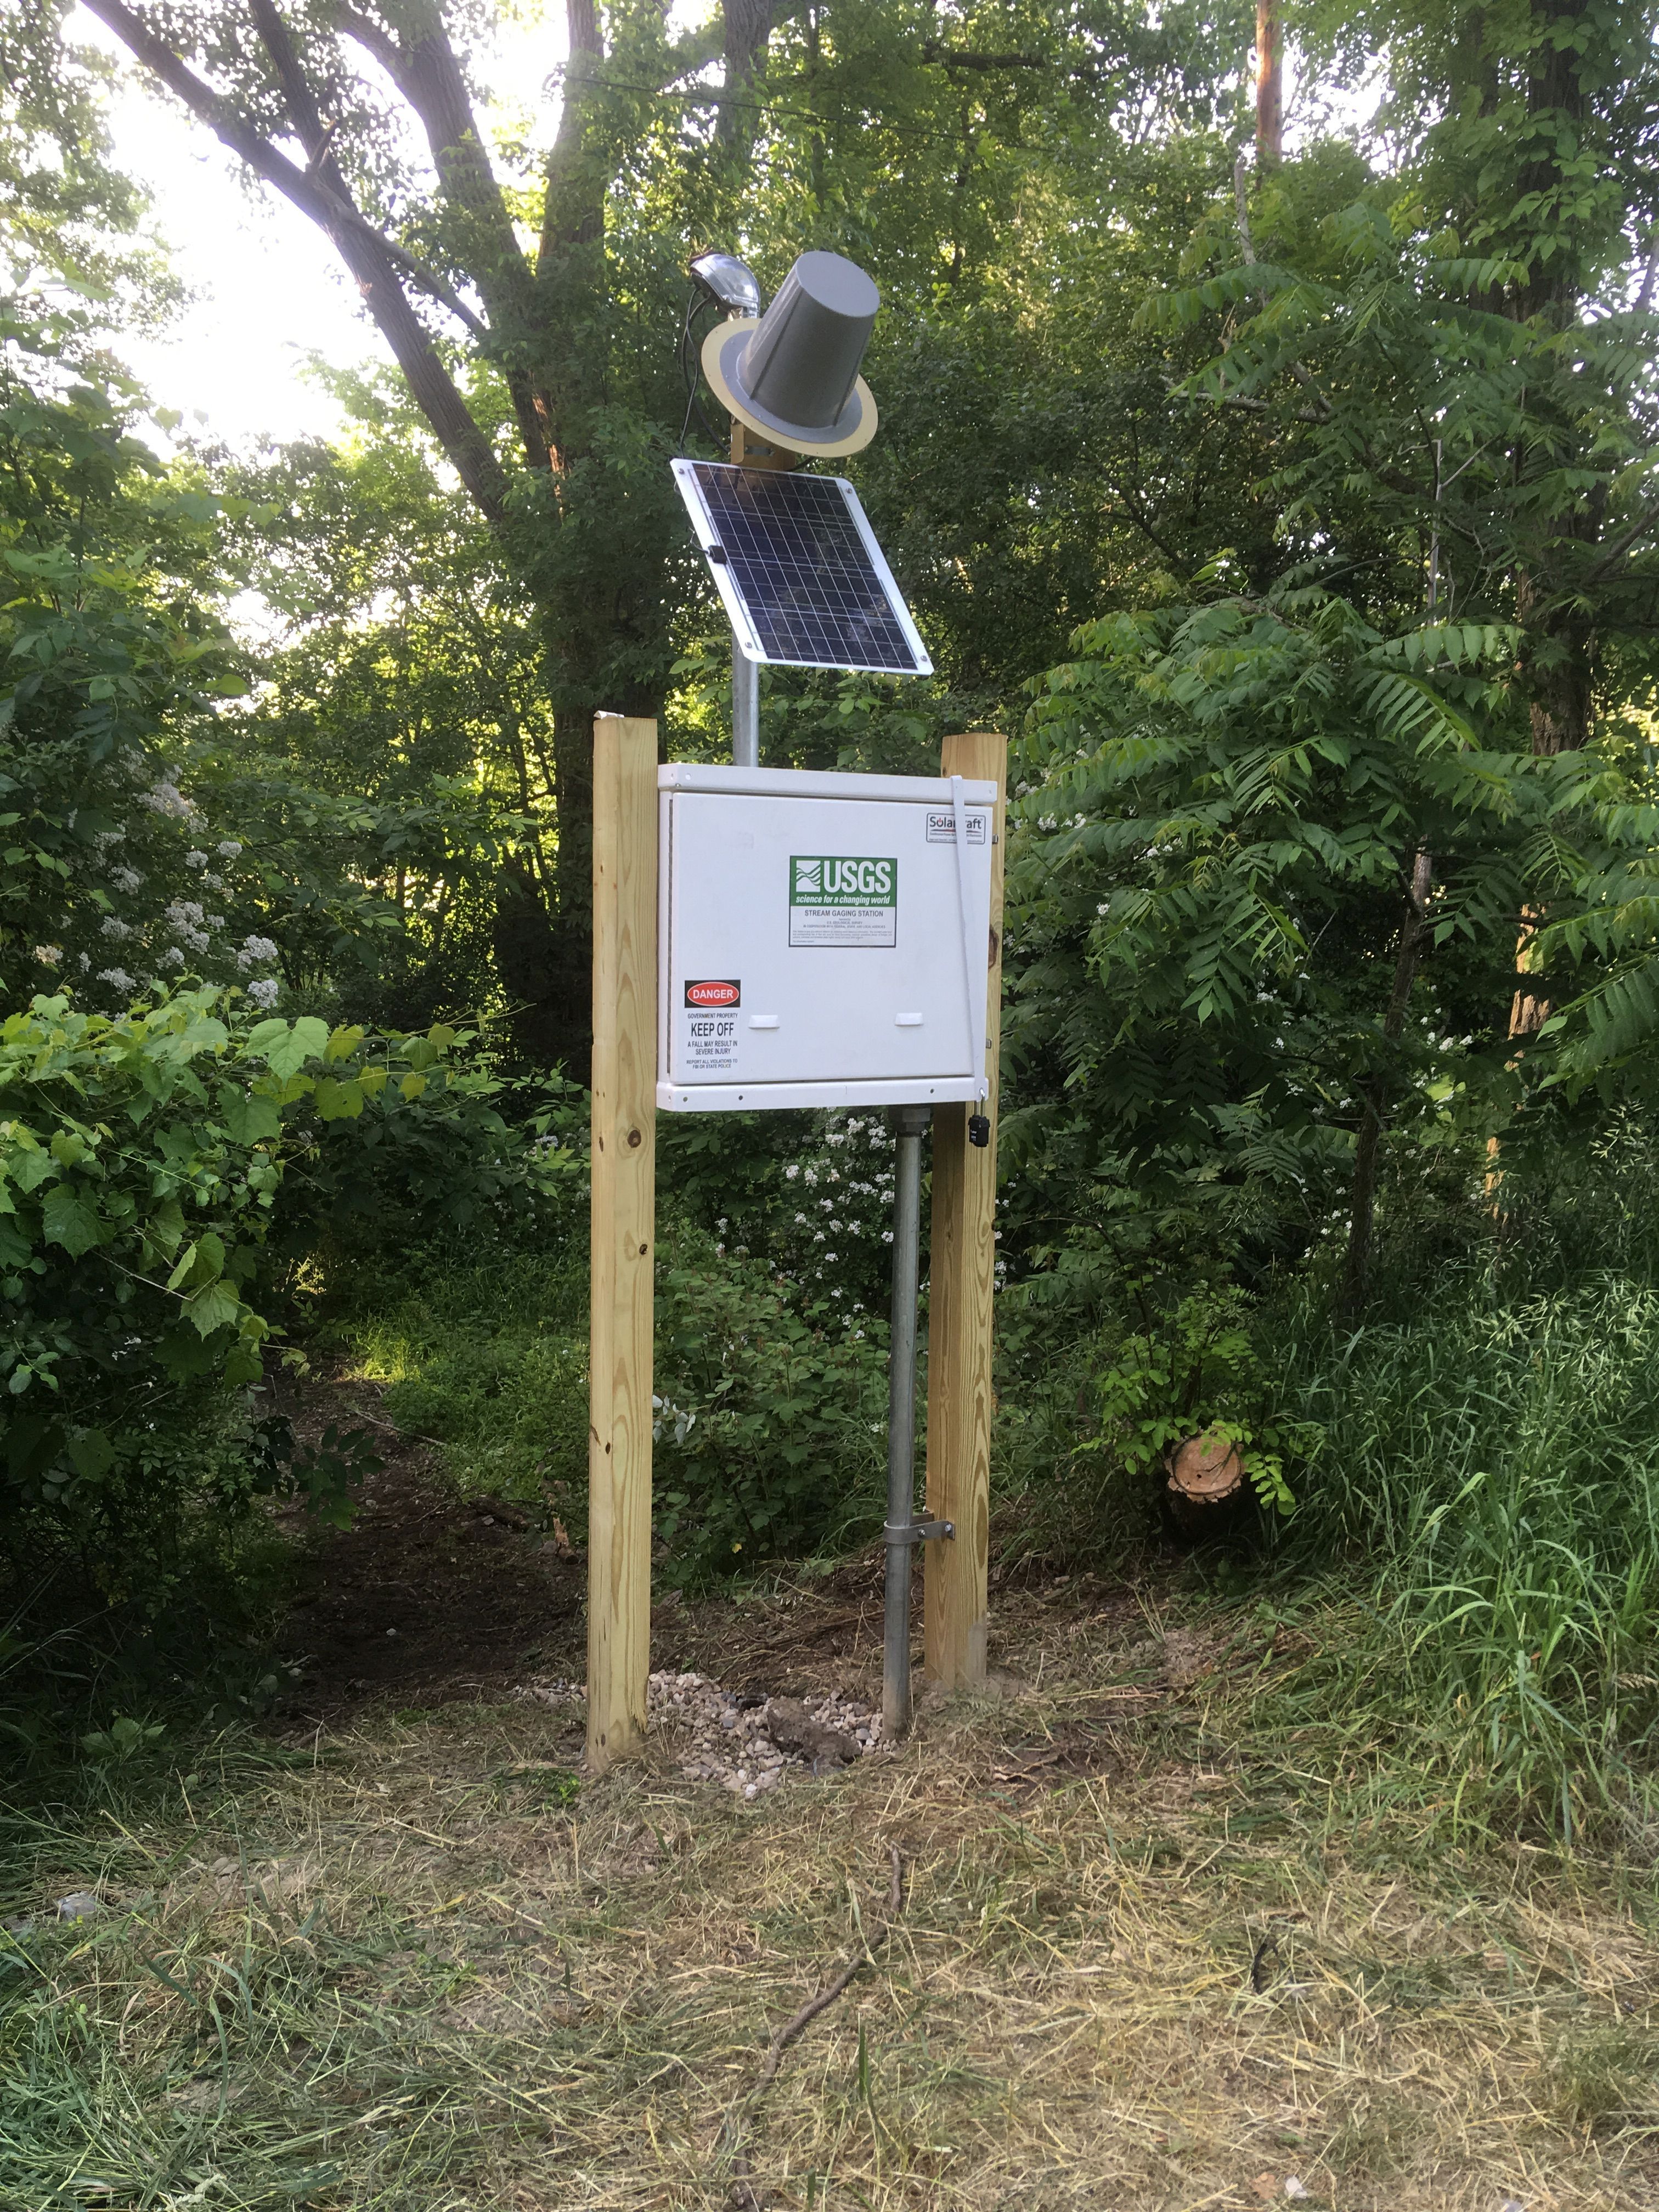 Station image
Summary of all available data for this site
Instantaneous-data availability statement