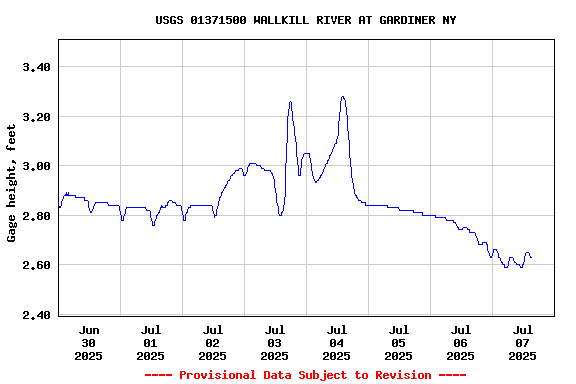
PROVISIONAL DATA SUBJECT TO REVISION
Click to hidestation-specific text
 Site Information
LOCATION.--Lat 41°41'10.1", long
74°09'55.0" referenced to North American Datum of
1983, Ulster County, NY, Hydrologic Unit 02020007, on left bank
400 ft upstream from bridge on U.S. Highway 44, 500 ft
downstream from Shawangunk Kill, and 0.7 mi northwest of
Gardiner.
DRAINAGE AREA.--695 mi².
PERIOD OF RECORD.--September 1924 to current year.
REVISIONS HISTORY.--WDR NY-90-1: Drainage area.
GAGE.--Water-stage recorder and crest-stage gage. Datum of gage is 185.70 ft above NGVD of 1929 and 183.70 ft above NAVD of 1988.
REMARKS.--Regulation at low flows by dams upstream and some diversions for municipalities and irrigational purposes.
Water Years 2014-24: Records fair except those for estimated daily discharges, which are poor.
EXTREMES FOR PERIOD OF RECORD.--Maximum discharge, 30,800 ft³/s, Oct. 16, 1955, gage height, 19.81 ft; minimum discharge, 9.5 ft³/s, Sept. 28, 1964; minimum gage height, 1.49 ft, Aug. 7, 1999.
 WaterAlert – get an
email or text (SMS) alert based on your chosen threshold.
WaterAlert – get an
email or text (SMS) alert based on your chosen threshold.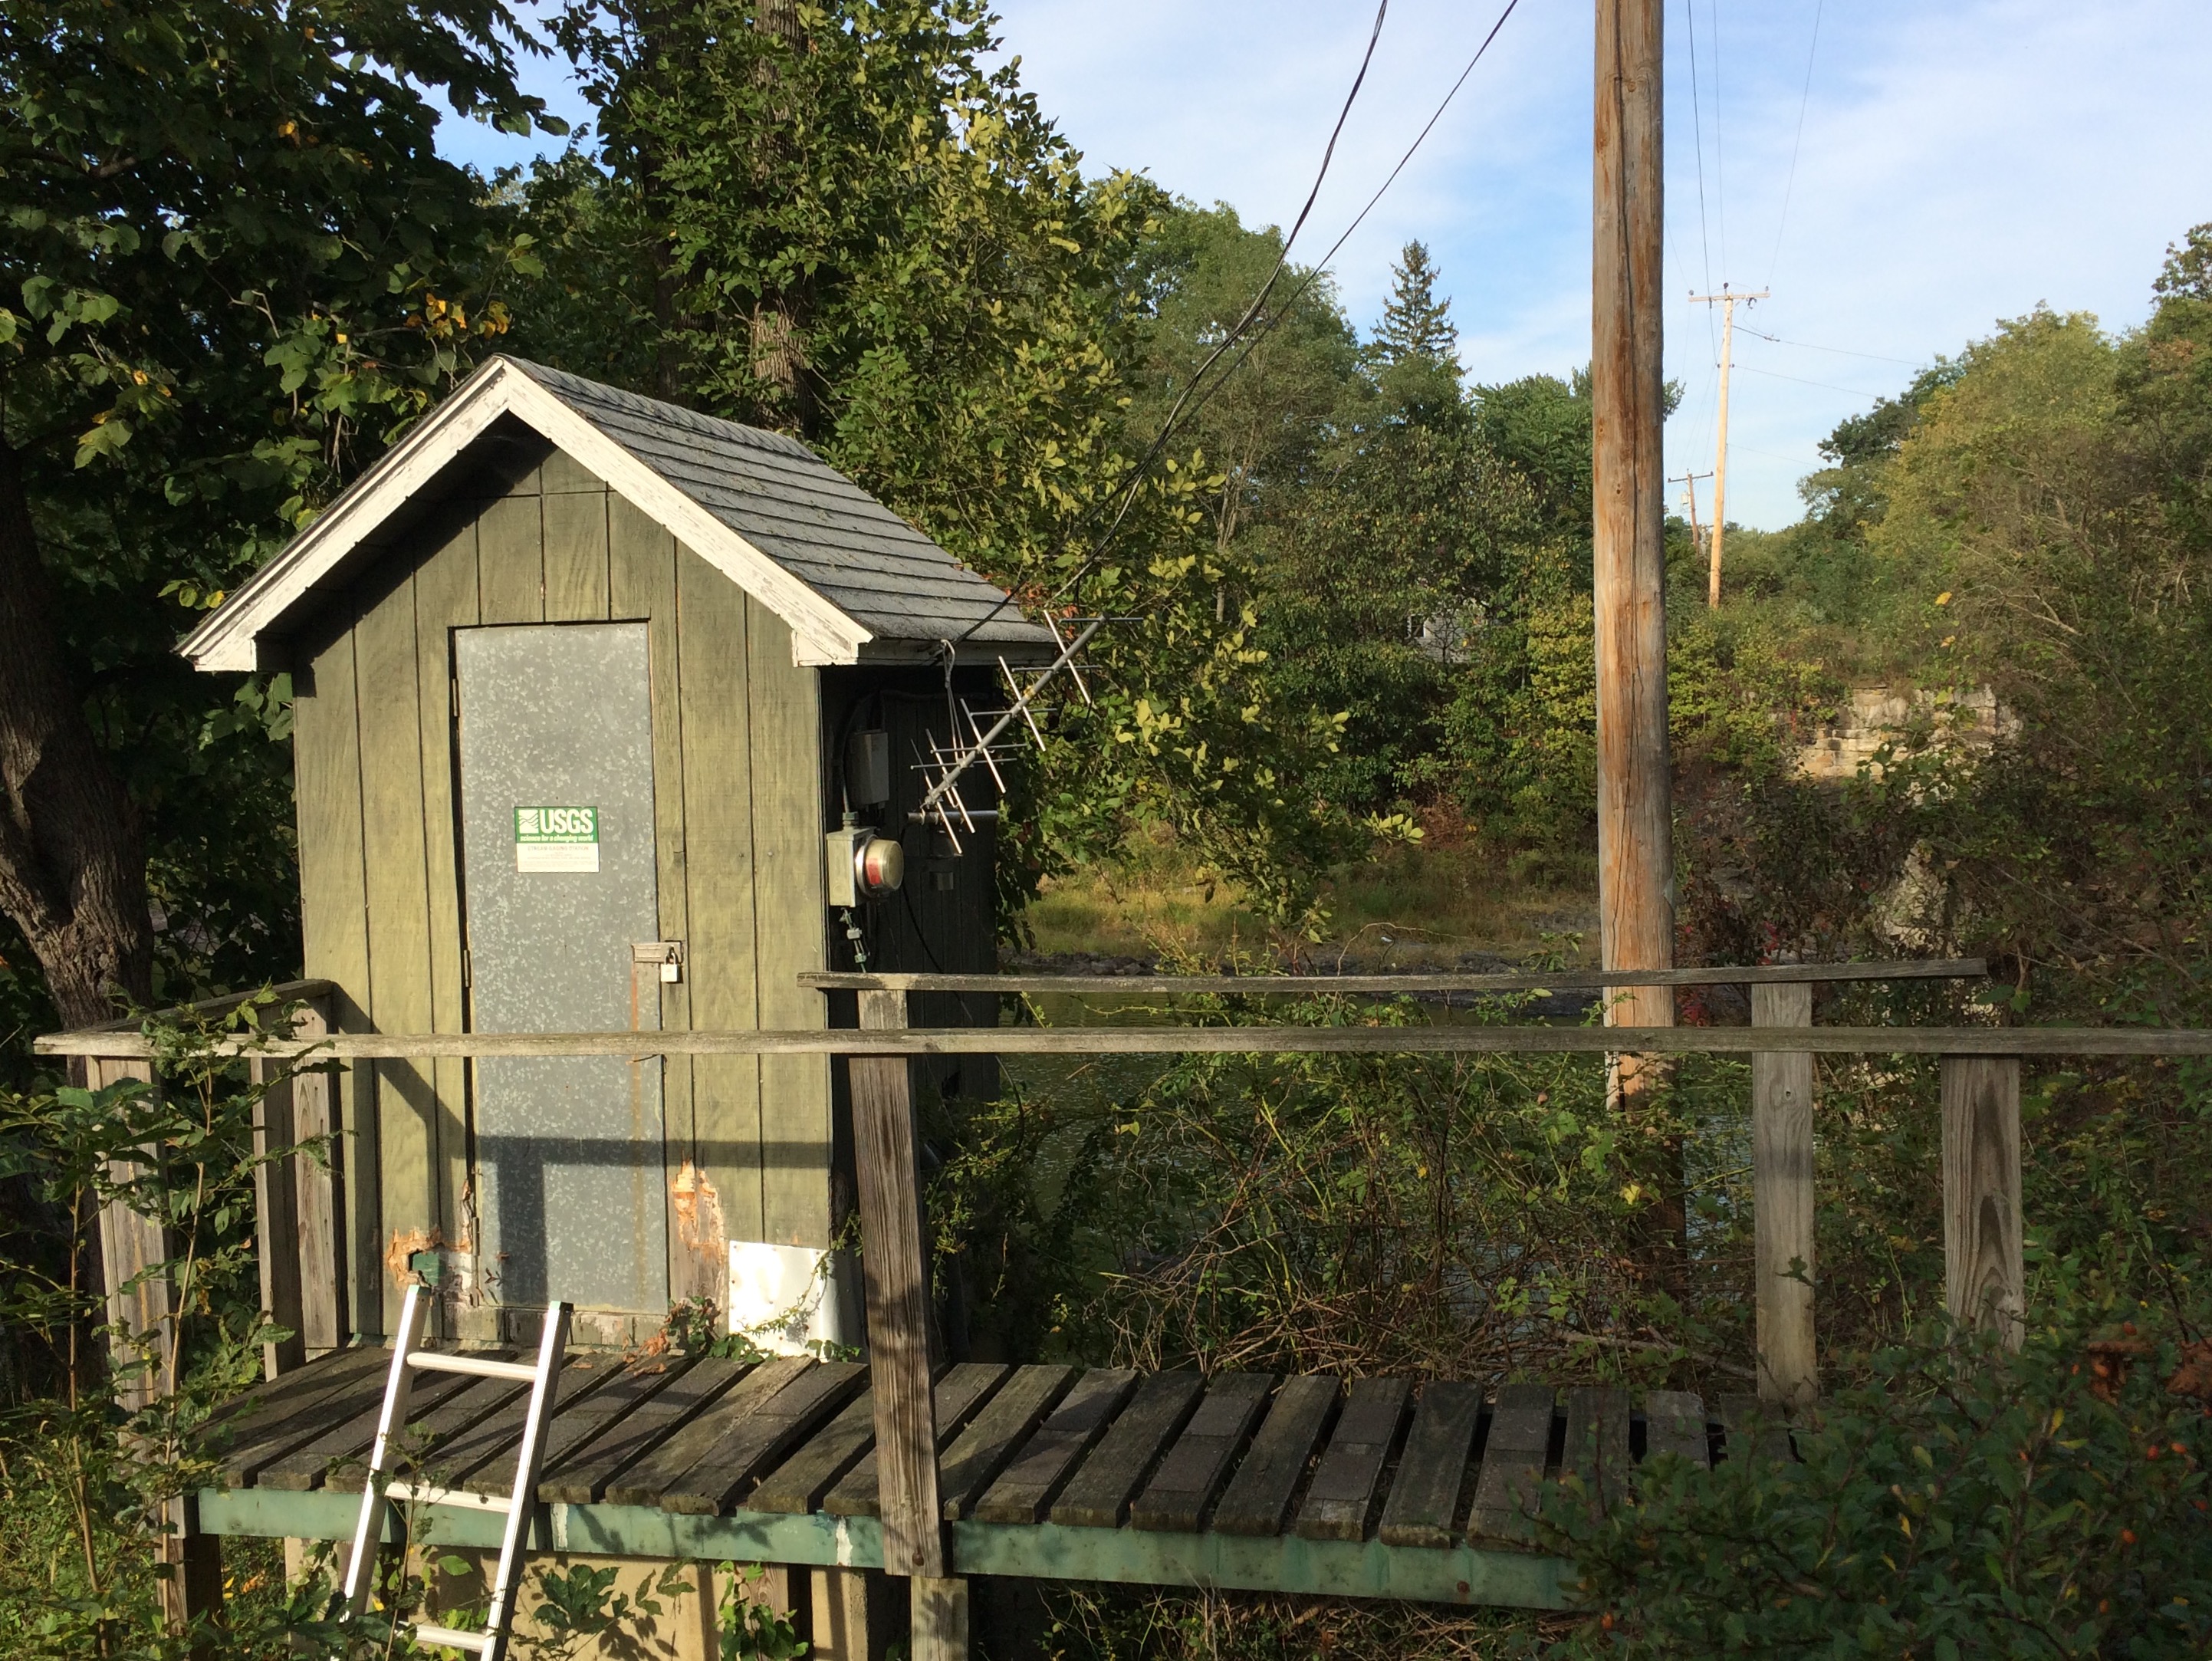 Station image
Summary of all available data for this site
Instantaneous-data availability statement