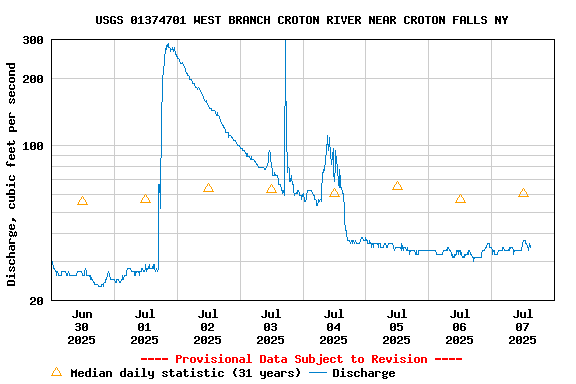
PROVISIONAL DATA SUBJECT TO REVISION
Click to hidestation-specific text
Funding for this site is provided by:
 Site Information
LOCATION.--Lat 41°21'28.8", long
73°40'04.7" referenced to North American Datum of
1983, Putnam County, NY, Hydrologic Unit 02030101, on right
bank 500 ft downstream from dam on Croton Falls Reservoir, 0.7
mi north of Croton Falls, 1.0 mi upstream from mouth, and 4.0
mi southwest of Brewster.
DRAINAGE AREA.--80.4 mi².
PERIOD OF RECORD.--January 1994 to current year.
REVISIONS HISTORY.--WDR NY-2005-1: 1996-97, 2003. Discharge for the period Dec. 20, 2017 to Jan. 6, 2018, was revised on Mar. 20, 2019, based on removing estimated discharges.
GAGE.--Water-stage recorder, crest-stage gage, and concrete control. Datum of gage is 205.48 ft above NAVD of 1988.
REMARKS.--Flow regulated by Croton Falls Reservoir.
Water Years 2014-18: Records good.
Water Year 2019: Records good except those for July 22 to Sept. 9, which are poor.
Water Years 2020-24: Records good except those for estimated daily discharges, which are poor.
EXTREMES FOR PERIOD OF RECORD.--Maximum discharge, 2,720 ft³/s, Apr. 17, 2007, gage height, 7.51 ft; minimum discharge not determined.
 WaterAlert – get an
email or text (SMS) alert based on your chosen threshold.
WaterAlert – get an
email or text (SMS) alert based on your chosen threshold.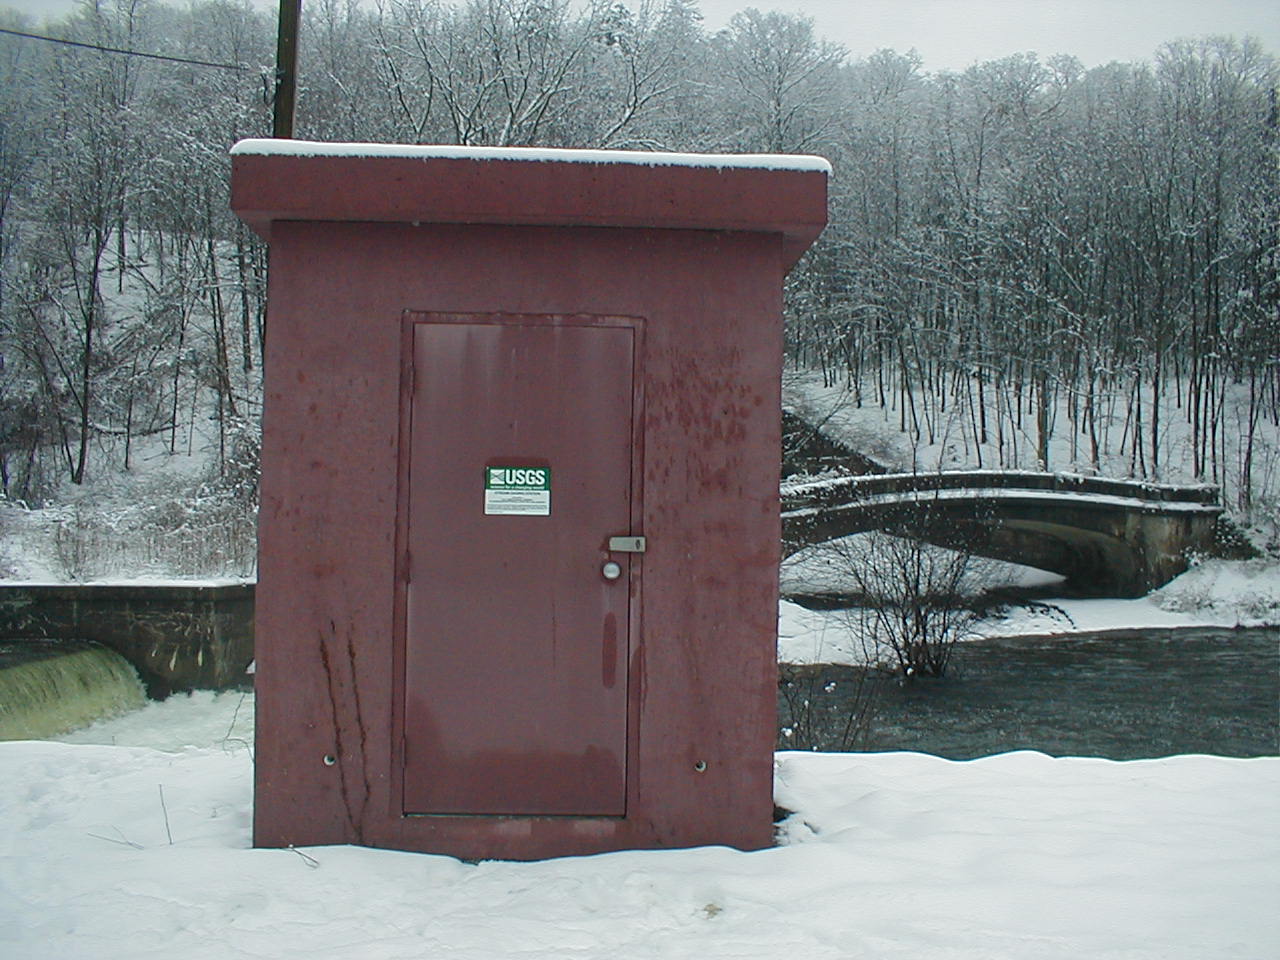 Station image
Summary of all available data for this site
Instantaneous-data availability statement