PROVISIONAL DATA SUBJECT TO REVISION
Click to hidestation-specific text
Funding for this site is provided by:
 Site Information
LOCATION.--Lat 41°17'15.4", long
73°45'13.1" referenced to North American Datum of
1983, Westchester County, NY, Hydrologic Unit 02030101, on
right bank 20 ft upstream from bridge on State Highway 35
(Amawalk Road), 500 ft downstream from dam on Amawalk
Reservoir, and 1.0 mi east of Amawalk.
DRAINAGE AREA.--19.7 mi².
PERIOD OF RECORD.--Occasional low-flow and/or miscellaneous discharge measurements, water year 1976. March 1994 to current year.
GAGE.--Water-stage recorder and crest-stage gage. Datum of gage is 313.93 ft above NAVD of 1988.
REMARKS.--Flow regulated by Amawalk Reservoir. Water Years 2014-24: Records fair.
EXTREMES FOR PERIOD OF RECORD.--Maximum discharge, 1,440 ft³/s, Apr. 17, 2007, gage height, 12.64 ft; minimum discharge not determined.
 WaterAlert – get an
email or text (SMS) alert based on your chosen threshold.
WaterAlert – get an
email or text (SMS) alert based on your chosen threshold.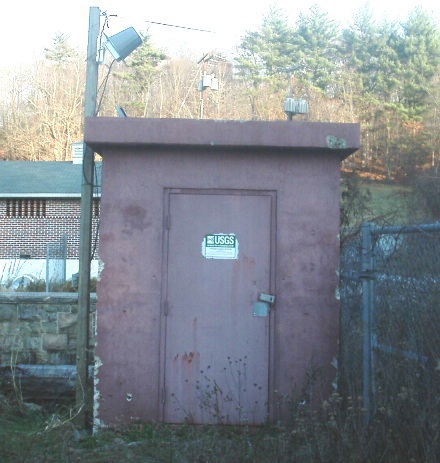 Station image
Summary of all available data for this site
Instantaneous-data availability statement

