PROVISIONAL DATA SUBJECT TO REVISION
Click to hidestation-specific text
Funding for this site is provided by:
 Site Information
LOCATION.--Lat 42°09'03", long
74°36'05" referenced to North American Datum of 1983,
Delaware County, NY, Hydrologic Unit 02040102, on left bank 60
ft upstream from private bridge, 0.7 mi upstream from mouth,
1.0 mi east of Arkville, and 2.4 mi east of
Margaretville.
DRAINAGE AREA.--46.7 mi².
PERIOD OF RECORD.--October 1997 to current year.
REVISIONS HISTORY.--WDR NY-99-1: 1998 (P).
GAGE.--Water-stage recorder and crest-stage gage. Datum of gage is 1,370.79 ft above NAVD of 1988.
REMARKS.--Diurnal fluctuation at medium and low flow from unknown source upstream from station.
Water Years 2014-23: Records fair except those for estimated daily discharges, which are poor.
EXTREMES FOR PERIOD OF RECORD.--Maximum discharge, 13,800 ft³/s, Aug. 28, 2011, gage height, 16.26 ft, outside gage height was 15.06 ft, from crest-stage gage, from rating curve extended above 1,900 ft³/s on basis of runoff comparison of peak flow from contracted-opening measurement at site 2.2 mi upstream; minimum discharge, 3.02 ft³/s, Aug. 29, 2022, gage height, 3.50 ft; minimum gage height, 3.25 ft, Sept. 14, 24, 2005.
EXTREMES OUTSIDE PERIOD OF RECORD.--Maximum discharge, 7,600 ft³/s, Jan. 19, 1996, on basis of contracted-opening measurement of peak flow at site 0.2 mi downstream, drainage area, 47.0 mi².
 WaterAlert – get an
email or text (SMS) alert based on your chosen threshold.
WaterAlert – get an
email or text (SMS) alert based on your chosen threshold.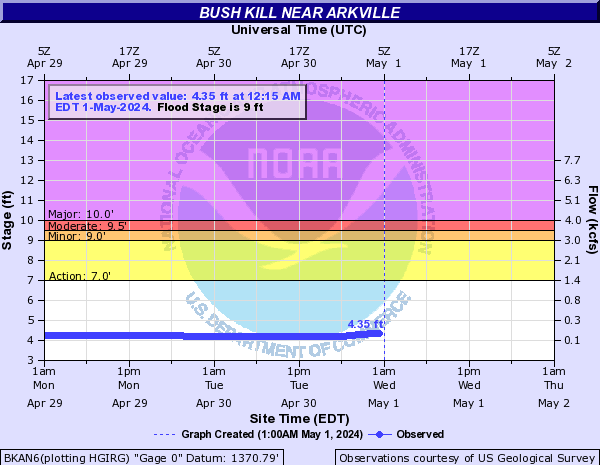
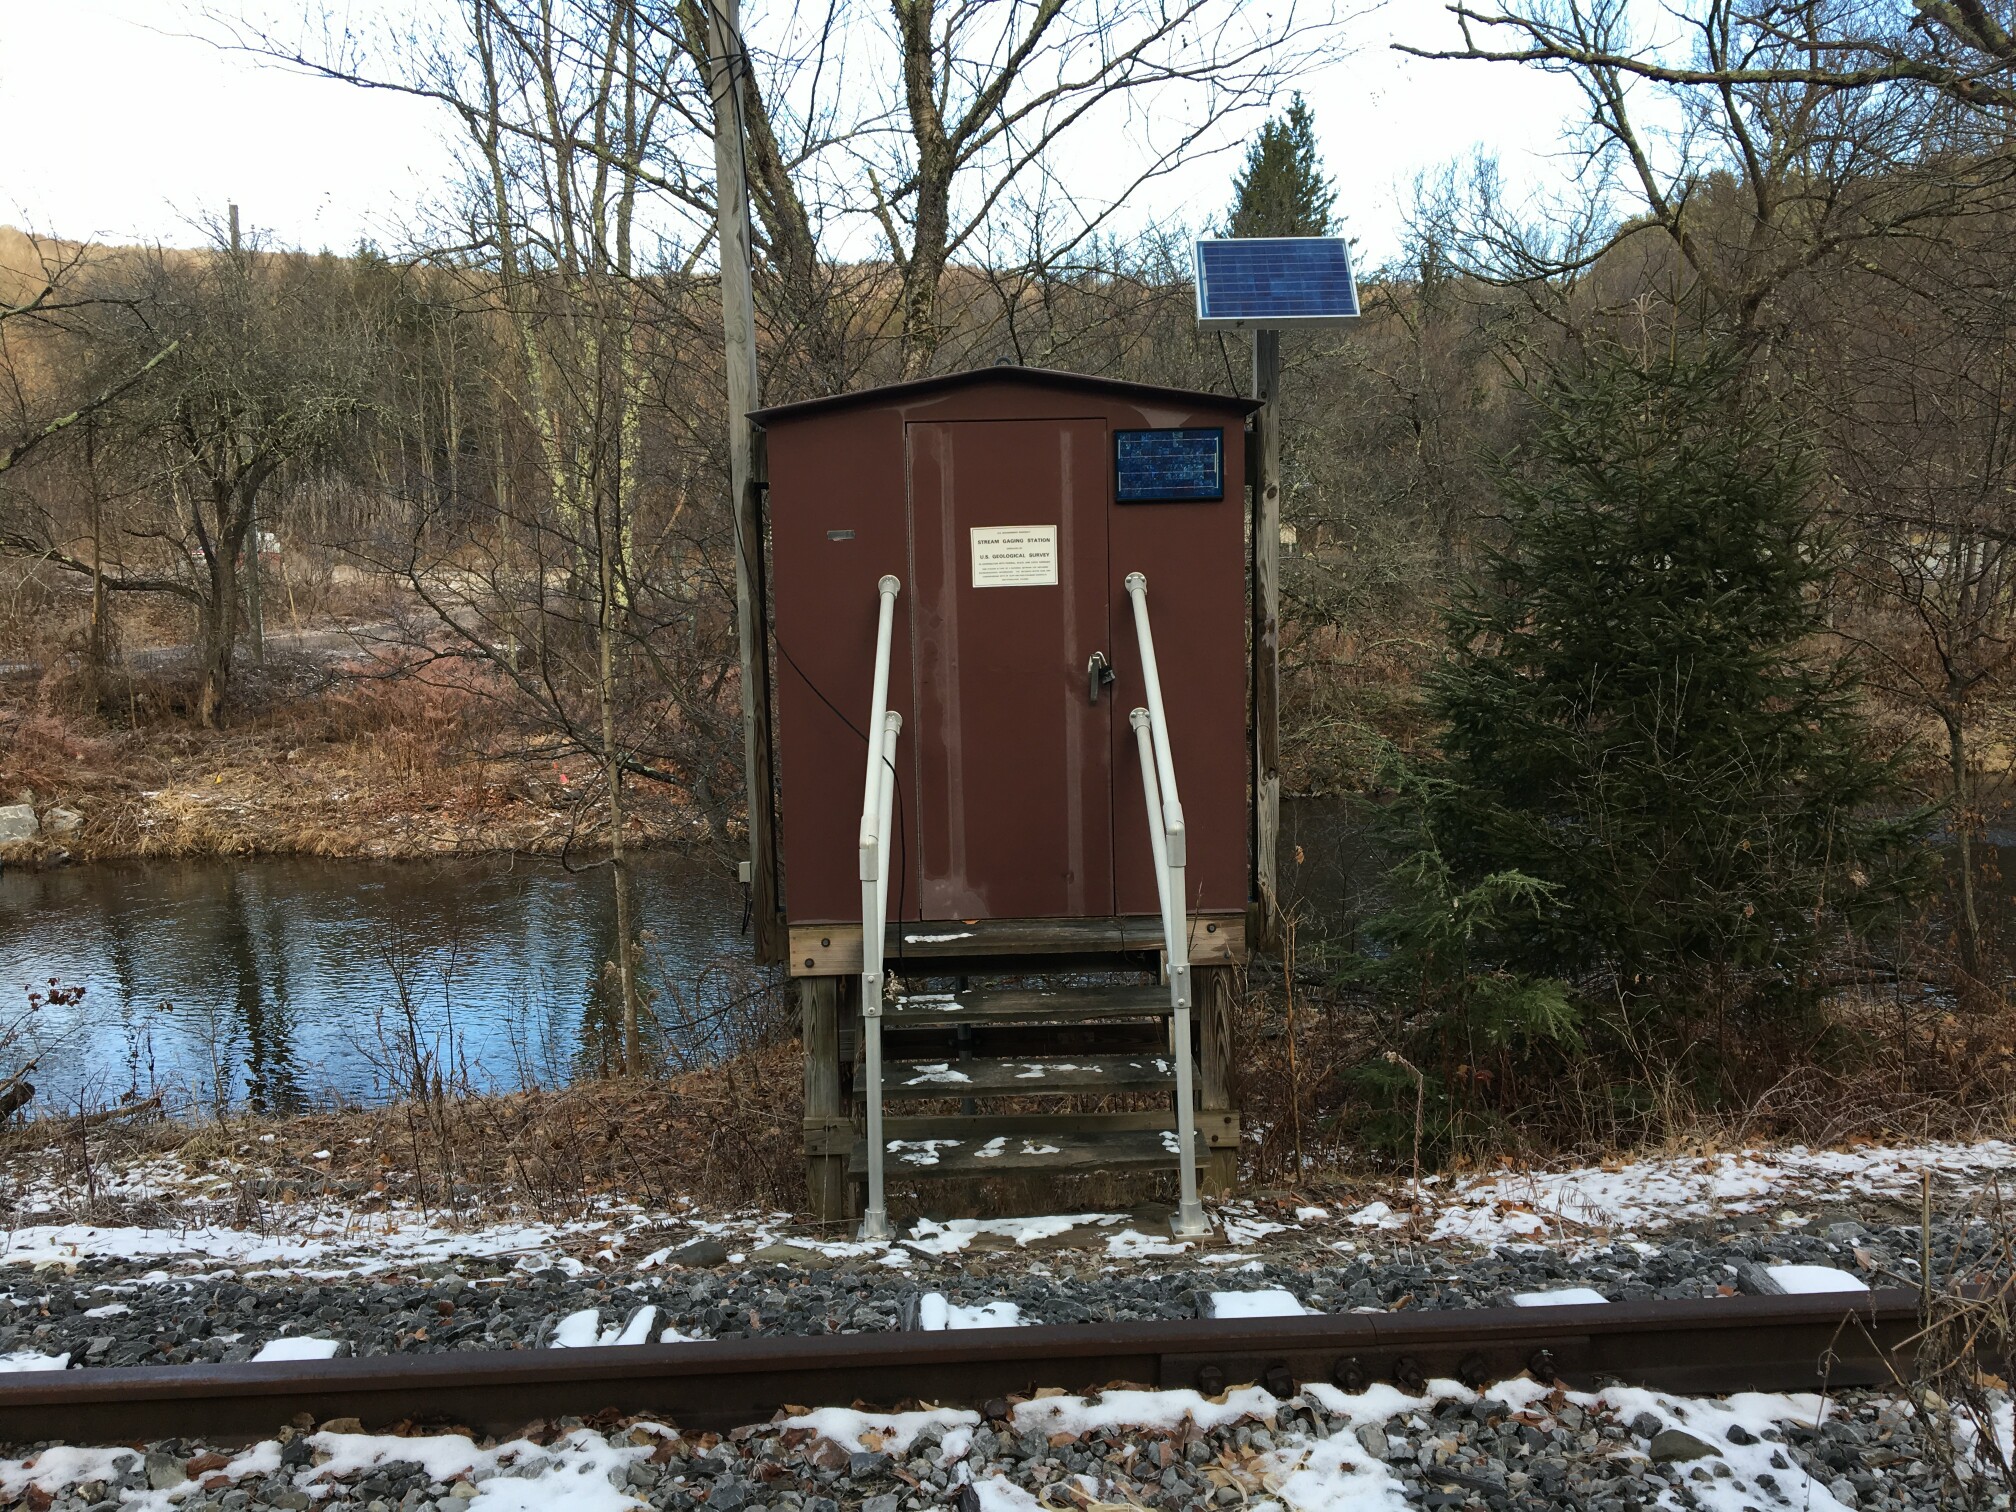 Station image
Summary of all available data for this site
Instantaneous-data availability statement

