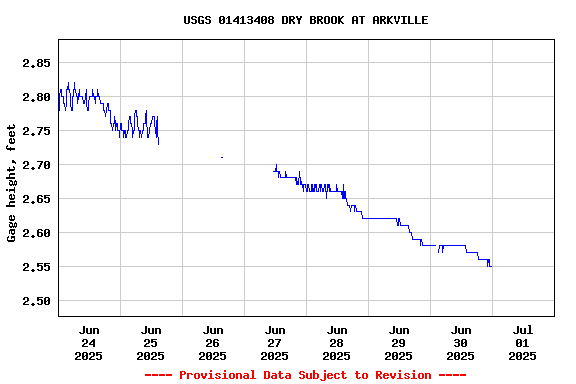
PROVISIONAL DATA SUBJECT TO REVISION
Click to hidestation-specific text
Funding for this site is provided by:
 Site Information
LOCATION.--Lat 42°08'48", long
74°37'24" referenced to North American Datum of 1983,
Delaware County, NY, Hydrologic Unit 02040102, on left bank 80
ft upstream from bridge on State Highway 28 in Arkville, 0.6 mi
upstream from mouth, 1.3 mi east of Margaretville, and 4.5 mi
west of Fleischmanns.
DRAINAGE AREA.--82.2 mi².
PERIOD OF RECORD.--Maximum only--October to November 1996. December 1996 to current year.
GAGE.--Water-stage recorder and crest-stage gage. Datum of gage is 1,335.67 ft above NAVD of 1988.
REMARKS.--Water Years 2014-20: Records good except those for estimated daily discharges, which are poor. Water Years 2021-24: Records fair except those for estimated daily discharges, which are poor.
EXTREMES FOR PERIOD OF RECORD.--Maximum discharge, 24,600 ft³/s, Aug. 28, 2011, gage height, about 17.1 ft, from floodmarks, from rating curve extended above 4,700 ft³/s on basis of contracted-opening and flow-over-road and flow-through-culvert measurement of peak flow; minimum daily discharge, about 7.0 ft³/s, Sept. 13, 2002, minimum instantaneous discharge not determined; minimum gage height, 0.71 ft, part or all of each day Sept. 28 to Oct. 4, 2014, Sept. 26-29, 2015.
EXTREMES OUTSIDE PERIOD OF RECORD.--Maximum discharge, about 12,000 ft³/s, Jan. 19, 1996, gage height, about 15.5 ft, from floodmarks, on basis of runoff comparisons with nearby stations.
 WaterAlert – get an
email or text (SMS) alert based on your chosen threshold.
WaterAlert – get an
email or text (SMS) alert based on your chosen threshold.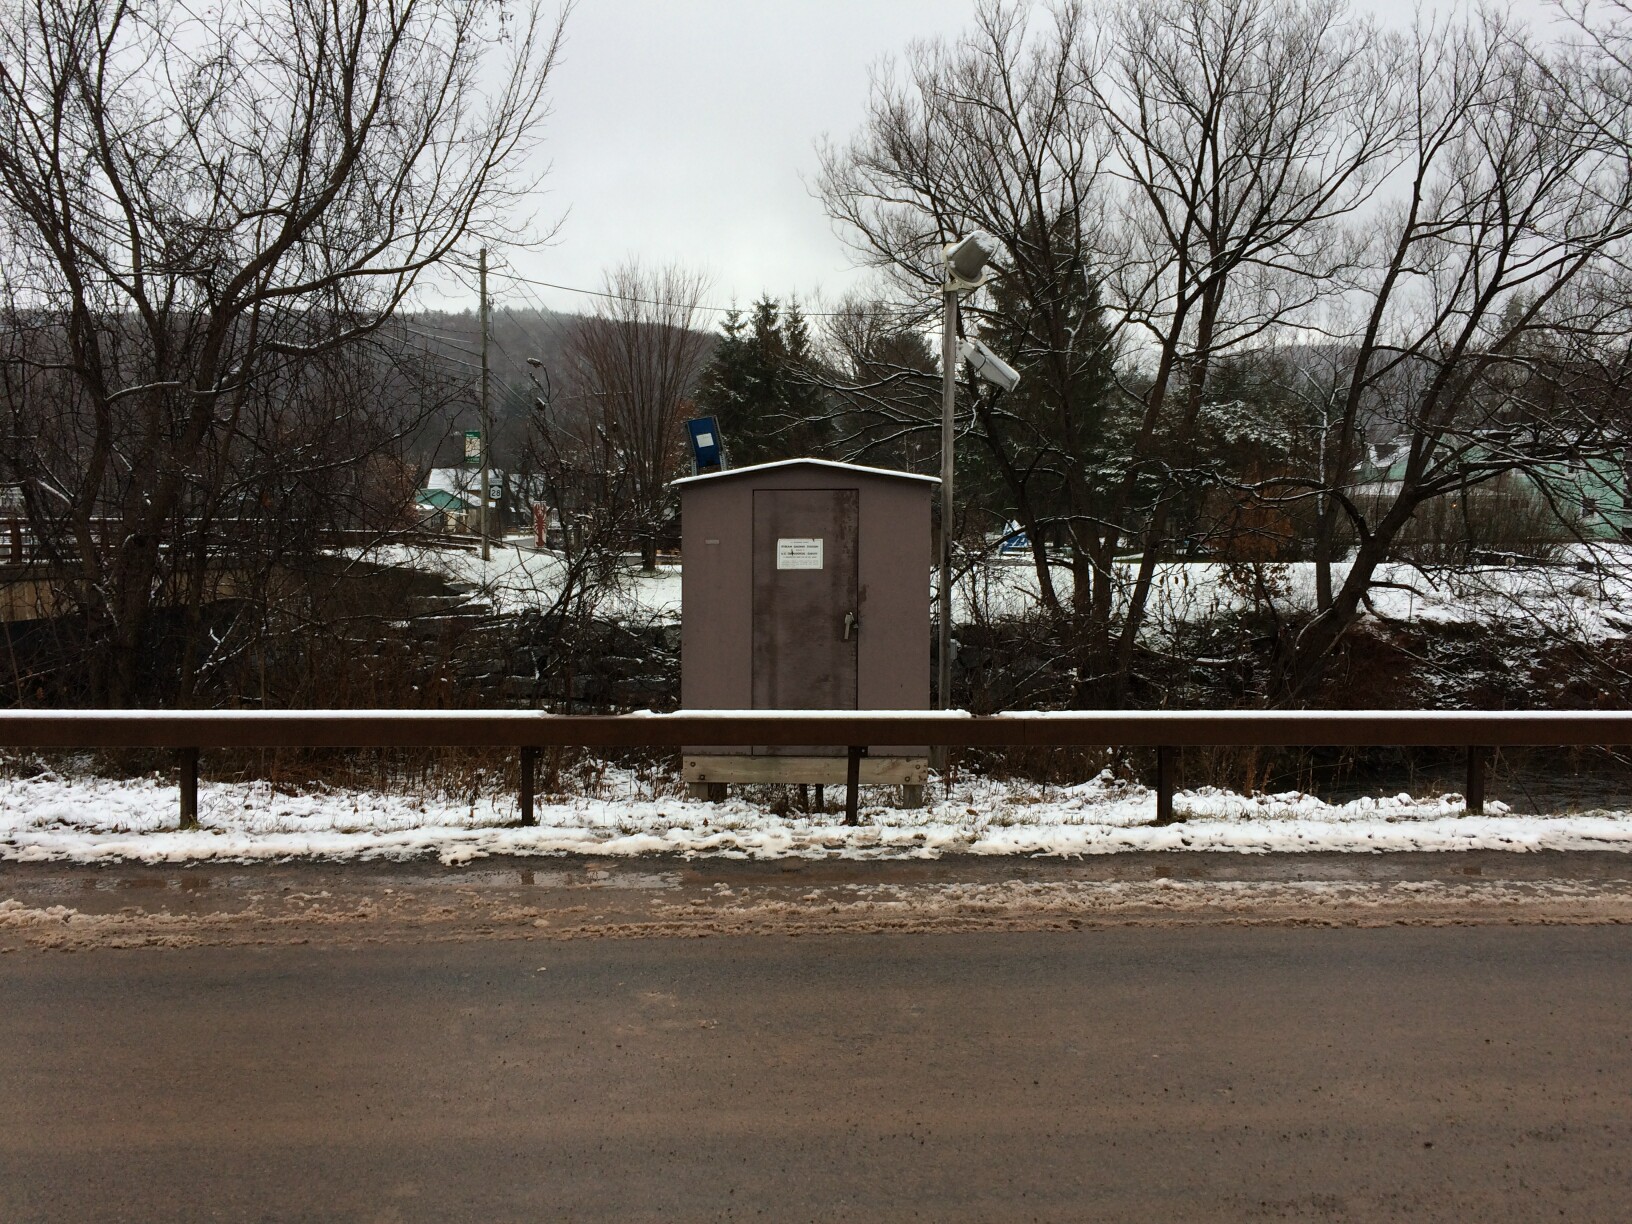 Station image
Summary of all available data for this site
Instantaneous-data availability statement