PROVISIONAL DATA SUBJECT TO REVISION
Click to hidestation-specific text
Funding for this site is provided by:
 Site Information
LOCATION.--Lat 42°02'55.3", long
75°29'06.7" referenced to North American Datum of
1983, Broome County, NY, Hydrologic Unit 02040101, on left bank
70 ft upstream from bridge on Old Route 17, 0.4 mi downstream
from Fly Creek, 4.0 mi upstream from West Branch Delaware
River, and 3.2 mi southwest of Deposit.
DRAINAGE AREA.--58.2 mi².
PERIOD OF RECORD.--December 2019 to current year.
REVISIONS HISTORY.--Discharge for the period Aug. 7, 2020, and Aug. 11, 12, 2020, was revised on April 22, 2021, based on changes to the stage-discharge rating. Discharge for the period Oct. 26, 2021, to Apr. 13, 2022, was revised on Feb. 9, 2023, based on changes to the stage-discharge rating.
GAGE.--Water-stage recorder and crest-stage gage. Datum of gage is 1,064.51 ft above NAVD of 1988.
REMARKS.--Water Years 2020-24: Records fair except those for estimated daily discharges, which are poor.
EXTREMES FOR PERIOD OF RECORD.--Maximum discharge, 4,640 ft³/s, Aug. 9, 2024, gage height, 12.37 ft; maximum gage height, 12.46 ft, Dec. 25, 2020; minimum discharge, 2.58 ft³/s, Aug. 29, 30, 2022, gage height, 3.79 ft; minimum gage height, 3.18 ft, Jan. 22, 2022, result of freezeup.
PERIOD OF DAILY RECORD1.--WATER TEMPERATURE: December 2019 to current year.
INSTRUMENTATION1.--Water-temperature satellite telemeter provides 15-minute-interval readings.
EXTREMES FOR PERIOD OF DAILY RECORD1.--WATER TEMPERATURE: Maximum, 27.7 °C, July 27, 2020; minimum, -0.2 °C, Feb. 7, 8, 12, 16, 17, 2021.
1 Water-Quality Records
 WaterAlert – get an
email or text (SMS) alert based on your chosen threshold.
WaterAlert – get an
email or text (SMS) alert based on your chosen threshold.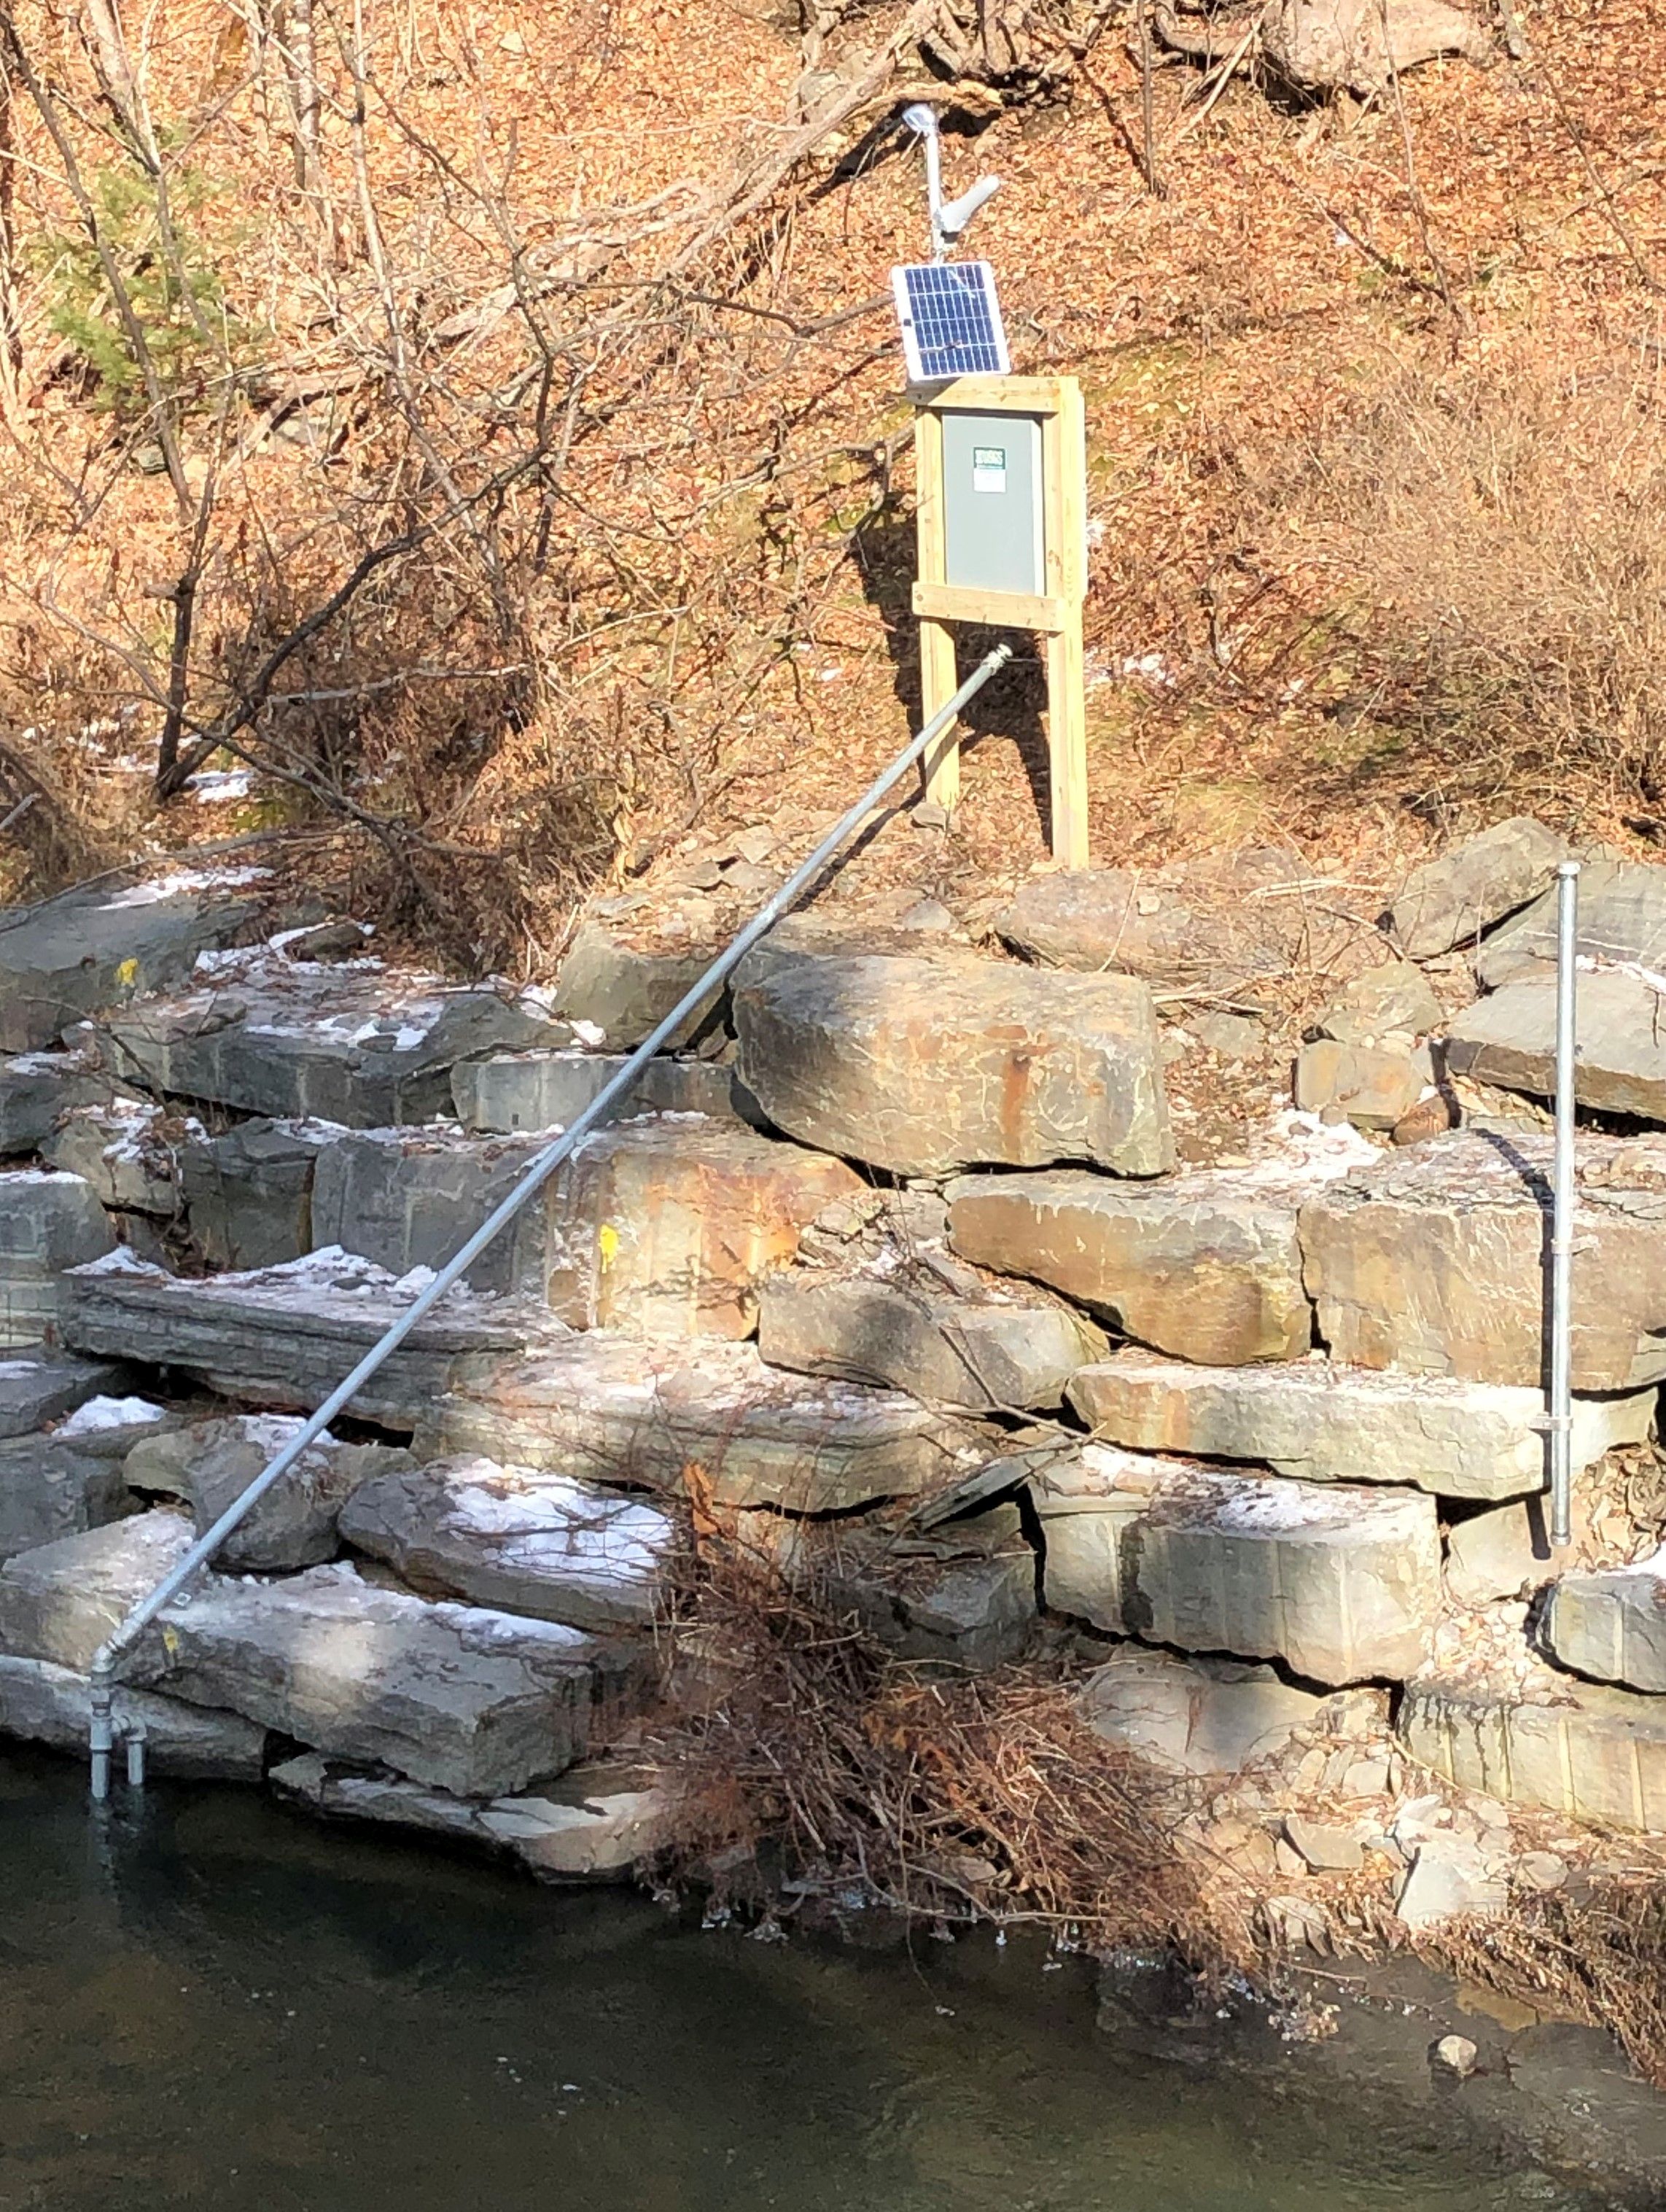 Station image
Summary of all available data for this site
Instantaneous-data availability statement

