PROVISIONAL DATA SUBJECT TO REVISION
Click to hidestation-specific text
Funding for this site is provided by:
 Site Information
LOCATION.--Lat 41°52'02.2", long
75°12'49.5" referenced to North American Datum of
1983, Wayne County, PA, Hydrologic Unit 02040101, on right bank
at Lordville-Equinunk Interstate Bridge at Lordville, 9.7 mi
southeast of Hancock.
DRAINAGE AREA.--1,590 mi².
PERIOD OF RECORD.--Maximum only--June 2006, July 2006 to current year.
REVISIONS HISTORY.--WDR NY-82-1: Drainage area.
GAGE.--Water-stage recorder and crest stage gage. Datum of gage is 835.00 ft above NGVD of 1929 and 834.51 ft above NAVD of 1988.
REMARKS.--Entire flow from 371 mi² of drainage area controlled by Pepacton Reservoir (station 01416900), and entire flow from 454 mi² of drainage area controlled by Cannonsville Reservoir (station 01424997). Part of flow from these reservoirs diverted for New York City municipal supply. Remainder of flow (except for conservation releases and spill) impounded for release during periods of low flow in the lower Delaware River basin, as directed by the Delaware River Master.
Water Years 2014-24: Records good except those for estimated daily discharges, which are poor.
EXTREMES FOR PERIOD OF RECORD.--Maximum discharge 126,000 ft³/s, June 28, 2006, gage height, 28.87 ft, from floodmark, from rating curve extended above 39,000 ft³/s on basis of runoff comparisons with nearby stations; minimum discharge, 371 ft³/s, Sept. 6, 2008, Sept. 28, 2010; minimum gage height, 5.37 ft, Sept. 28, 2010.
EXTREMES OUTSIDE PERIOD OF RECORD.--Maximum discharge, 95,600 ft³/s, Sept. 18, 2004, gage height, 23.53 ft, from floodmark, and 102,000 ft³/s, Apr. 3, 2005, gage height, 25.20 ft, from floodmark, both by runoff comparisons with nearby stations.
PERIOD OF DAILY RECORD1.--WATER TEMPERATURE: October 1967 to August 1971, June 1973 to May 1996, July 2006 to current year. SPECIFIC CONDUCTANCE: June 2019 to current year. DISSOLVED OXYGEN: April 2021 to current year. pH: April 2021 to current year. TURBIDITY: April 2021 to current year.
INSTRUMENTATION1.--Multi-parameter water-quality sonde measures water temperature, specific conductance, dissolved oxygen, pH, and turbidity at 15-minute intervals since April 2021. From June 1987 to June 1989, water-temperature satellite telemeter provided one-hour-interval readings. From June 1973 to November 1989, water-temperature recorder provided one-hour-interval readings. Prior to August 1971, water-temperature recorder provided continuous recordings.
REMARKS1.--Temperature readings prior to Oct. 1, 2007, rounded to the nearest 0.5 °C. Water temperature is affected by release of water from upstream reservoir.
EXTREMES FOR PERIOD OF DAILY RECORD1.--WATER TEMPERATURE: Prior to Oct. 1, 2007--Maximum (water years 1968-70, 1973, 1975-86, 1989, 1991-95, 2007), 30.5 °C, June 16, 1976, July 10, 1981; minimum (water years 1968-71, 1974, 1977-78, 1980-96, 2007), 0.0 °C on many days during winter period. WATER TEMPERATURE: After Oct. 1, 2007--Maximum, 27.4 °C, June 10, 2008; minimum, -0.1 °C, Nov. 24, Dec. 12, 25, 26, 2013, Jan. 11, 2014, Jan. 12, 18, Feb. 11, 17, 18, 2016, and many days during 2017-22 winter periods, Jan. 6, 2025. SPECIFIC CONDUCTANCE: Maximum, 232 uS/cm at 25 °C, Feb. 18, 2025; minimum, 34 uS/cm at 25 °C, Nov. 1, 2019, Oct. 26, 27, 2021, Dec. 18, 19, 2023. DISSOLVED OXYGEN: Maximum, 15.5 mg/l, Feb. 4, 2023; minimum, 7.2 mg/l, May 27, 2021. pH: Maximum, 9.8, May 20, 2021; minimum, 6.2, Aug. 9, 2024. TURBIDITY: Maximum, above 1,000 FNU, Feb. 4, 2022; minimum, 0.3 FNU, May 4, 7, June 29, July 12, 2024.
1 Water-Quality Records
 WaterAlert – get an
email or text (SMS) alert based on your chosen threshold.
WaterAlert – get an
email or text (SMS) alert based on your chosen threshold.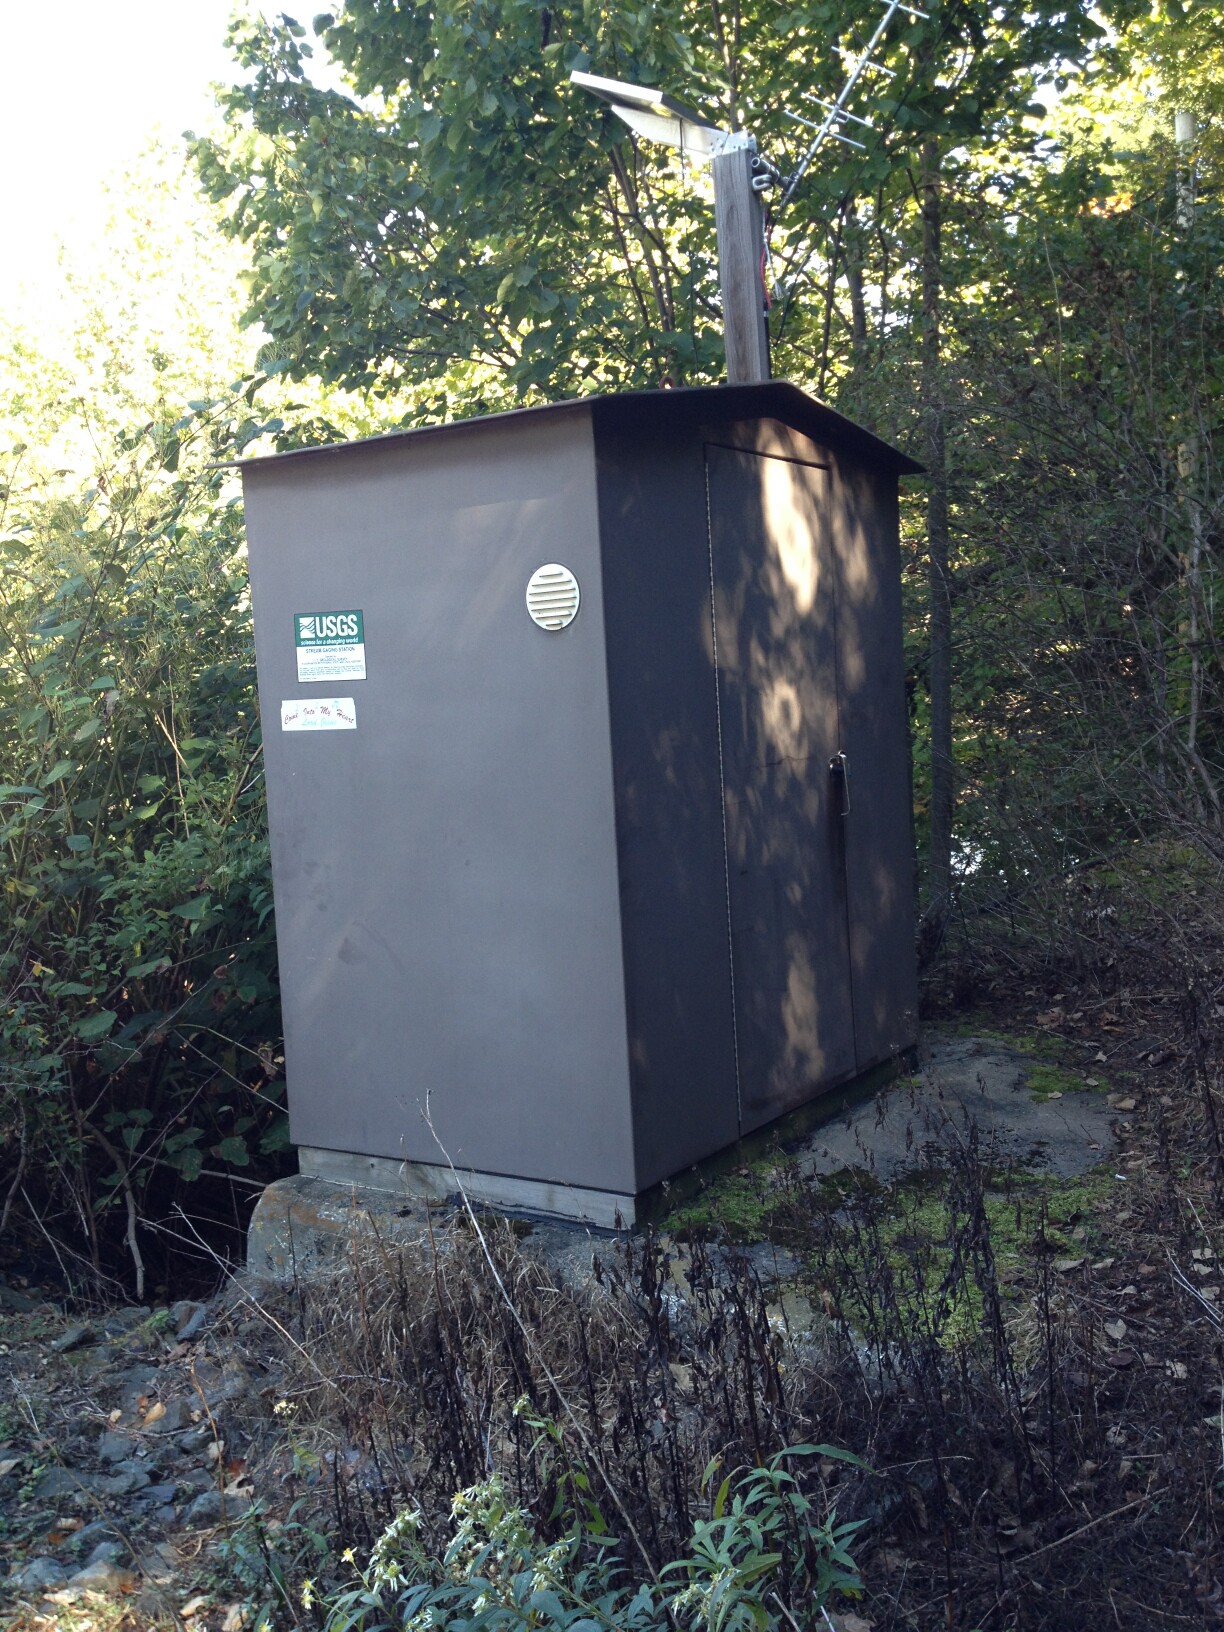 Station image
Summary of all available data for this site
Instantaneous-data availability statement

