PROVISIONAL DATA SUBJECT TO REVISION
Click to hidestation-specific text
Funding for this site is provided by:
 Site Information
LOCATION.--Lat 41°53'23.8", long
74°35'23.3" referenced to North American Datum of
1983, Sullivan County, NY, Hydrologic Unit 02040104, on left
bank 50 ft downstream from covered bridge, 300 ft upstream from
small tributary, 2.2 mi downstream from confluence of East and
West Branches, and 2.2 mi southwest of Claryville.
DRAINAGE AREA.--66.6 mi².
PERIOD OF RECORD.--November 1937 to May 1949, July 1951 to current year. Prior to July 1951, published as "at Halls Mills near Curry" (station 01435500).
REVISIONS HISTORY.--WDR NY-75-1: Gage datum. WDR NY-82-1: Drainage area. Datum of gage was revised on May 5, 2025, from 1,521.67 ft to 1,521.83 ft above NAVD of 1988, based on an updated geodetic survey. Temperature records for the period Aug. 26, 2024 to Mar. 28, 2025 were revised on June 3, 2025, based on changes to instrumentation.
GAGE.--Water-stage recorder and crest-stage gage. Datum of gage is 1,522.37 ft above NGVD of 1929 and 1,521.83 ft above NAVD of 1988. Prior to Oct. 1, 1974, at datum 6.00 ft higher. Oct. 1, 1974 to Sept. 30, 1979 at datum 5.00 ft higher. November 1937 to May 1949, at site 1.3 mi downstream at elevation 1,470 ft above NGVD of 1929, from topographic map.
REMARKS.--Water Years 2014, 2018-23: Records fair except those for estimated daily discharges, which are poor. Water Years 2015-17, 2024: Records good except those for estimated daily discharges, which are poor.
EXTREMES FOR PERIOD OF RECORD.--Maximum discharge, 20,900 ft³/s, Aug. 28, 2011, gage height, 14.64 ft; minimum discharge, 6.8 ft³/s, Sept. 24, 25, 1964.
EXTREMES OUTSIDE PERIOD OF RECORD.--Flood of Nov. 25, 1950, reached a stage of about 15.0 ft, present datum, from floodmarks, discharge, 23,400 ft³/s, from slope-area measurement of peak flow.
PERIOD OF DAILY RECORD1.--WATER TEMPERATURE: January 2012 to current year. SPECIFIC CONDUCTANCE: January 2020 to current year.
INSTRUMENTATION1.--A continuous water-quality monitor with water temperature and specific conductance provides 15-minute-interval readings.
EXTREMES FOR PERIOD OF DAILY RECORD1.--WATER TEMPERATURE: Maximum, 23.9 °C, July 21, 2019; minimum, -0.1 °C, Feb. 18, 2013, several days during 2014, 2020 winter periods and Feb. 3, 2023. SPECIFIC CONDUCTANCE: Maximum, 56 uS/cm at 25 °C, Mar. 2, June 29, 2021; minimum, 13 uS/cm at 25 °C, Apr. 13, 2020, Aug. 23, 2021, Oct. 26, 27, 2021, Apr. 8, 2022, Dec. 7, 2022.
1 Water-Quality Records
 WaterAlert – get an
email or text (SMS) alert based on your chosen threshold.
WaterAlert – get an
email or text (SMS) alert based on your chosen threshold.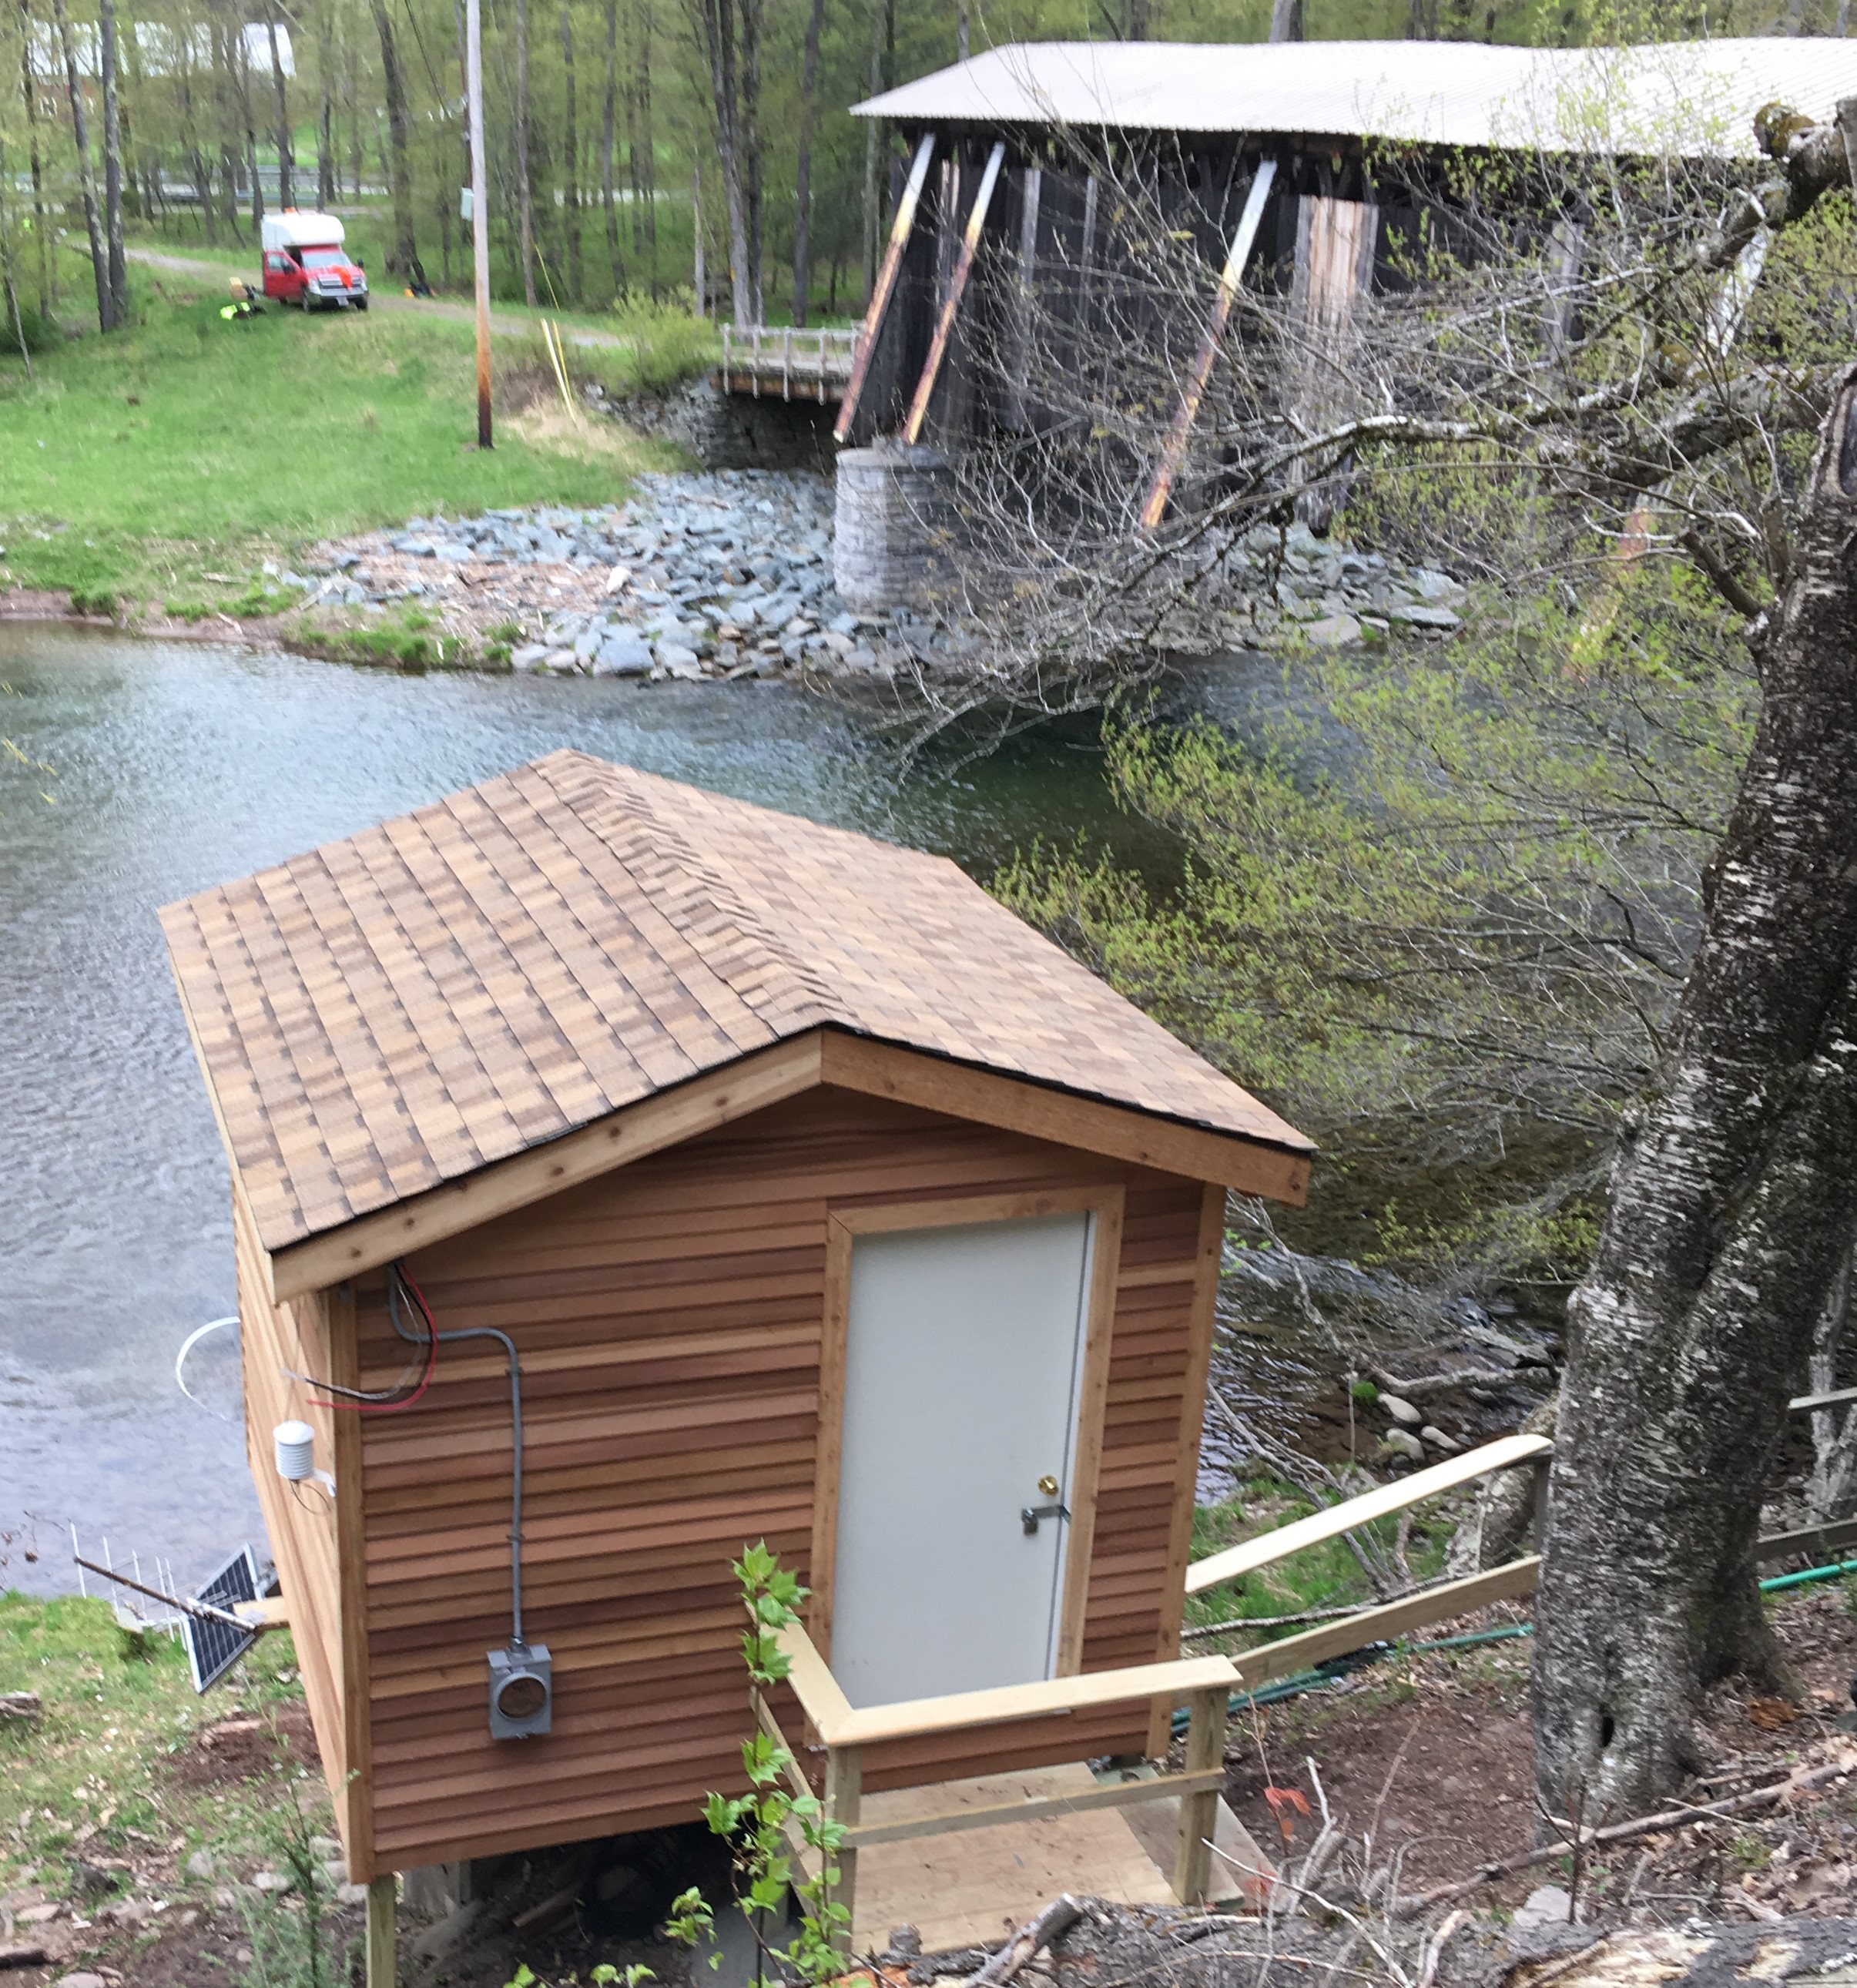 Station image
Summary of all available data for this site
Instantaneous-data availability statement

