PROVISIONAL DATA SUBJECT TO REVISION
Click to hidestation-specific text
Funding for this site is provided by:
 Site Information
LOCATION.--Lat 42°13'20.9", long
77°25'03.1" referenced to North American Datum of
1983, Steuben County, NY, Hydrologic Unit 02050104, on right
bank 250 ft downstream from bridge on County Highway 119, 0.3
mi southeast of West Cameron, and 1.7 mi north of
Cameron.
DRAINAGE AREA.--340 mi².
PERIOD OF RECORD.--January 1930 to September 1931, April 1937 to September 1970; 1971-72, 1974-2009 (annual maximum only); October 2009 to current year.
REVISIONS HISTORY.--WDR NY-69-1: Drainage area.
GAGE.--Water-stage recorder and crest-stage gage. Datum of gage is 1,037.71 ft above NGVD of 1929 (levels by Corps of Engineers) and 1,037.47 ft above NAVD of 1988. Prior to February 1937, nonrecording gage on highway bridge 250 ft upstream at same datum.
REMARKS.--Since March 1940, flood flows regulated by Arkport Reservoir (station 01521000), and since June 1949, by Almond Lake (station 01523000); normal regulation occasionally sufficient to affect figures of monthly runoff.
Water Years 2014-24: Records good except those for estimated daily discharges, which are fair.
EXTREMES FOR PERIOD OF RECORD.--Since construction of Almond Lake in 1949, maximum discharge, 43,000 ft³/s, June 23, 1972, gage height, 23.48 ft, from rating curve extended above 13,000 ft³/s on basis of slope-area measurement of peak flow; minimum daily discharge, 16 ft³/s, Sept. 14, 1952, Sept. 16, 1962; minimum instantaneous discharge not determined..
EXTREMES OUTSIDE PERIOD OF RECORD.--Maximum discharge, 35,000 ft³/s during flood of July 8-9, 1935, on basis of slope-area measurement of peak flow.
EXTREMES FOR PERIOD PRIOR TO REGULATION.--Prior to construction of Almond Lake in 1949, maximum discharge, 17,600 ft³/s, May 28, 1946, gage height, 18.09 ft; minimum daily discharge, 12 ft³/s, Aug. 28, Aug. 30 to Sept. 3, 1939; minimum instantaneous discharge not determined.
 WaterAlert – get an
email or text (SMS) alert based on your chosen threshold.
WaterAlert – get an
email or text (SMS) alert based on your chosen threshold.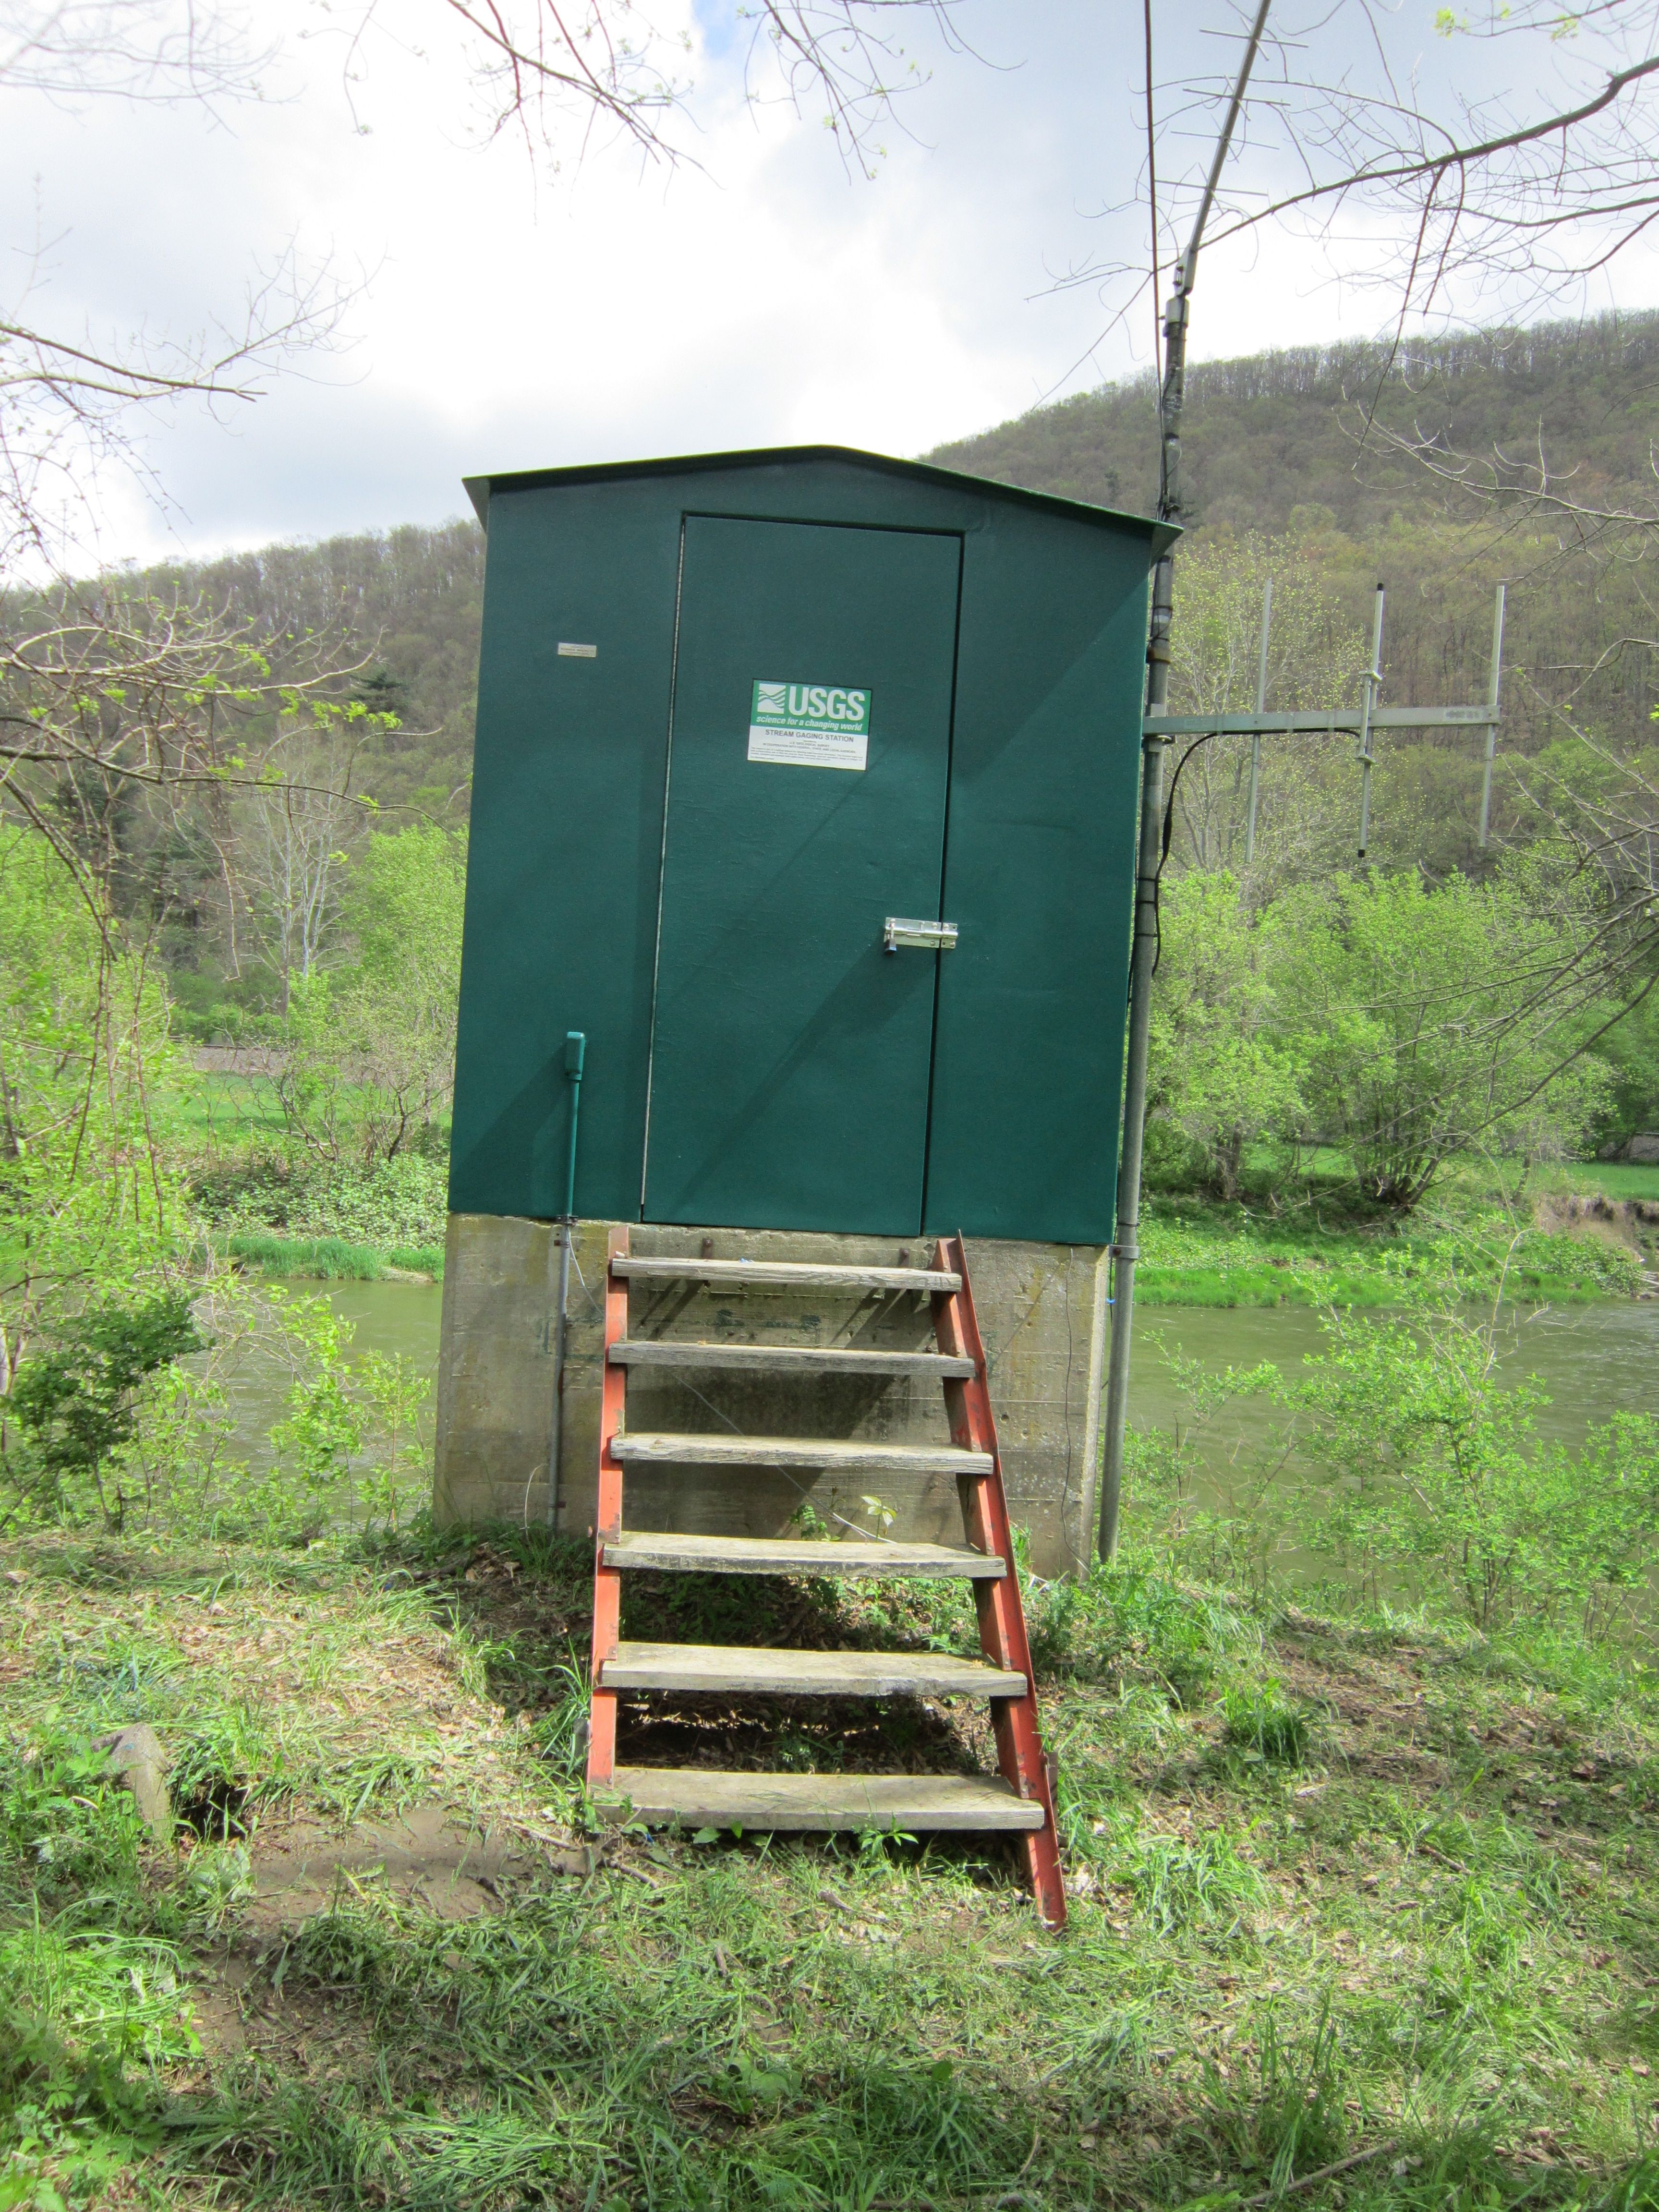 Station image
Summary of all available data for this site
Instantaneous-data availability statement

