PROVISIONAL DATA SUBJECT TO REVISION
Click to hidestation-specific text
Funding for this site is provided by:
 Site Information
LOCATION.--Lat 42°24'39.8", long
77°25'34.9" referenced to North American Datum of
1983, Steuben County, NY, Hydrologic Unit 02050105, on left
bank just downstream from bridge on State Highway 415, 0.2 mi
north of Avoca, 1.6 mi upstream from Goff Creek, and 6.4 mi
north of Bath.
DRAINAGE AREA.--152 mi².
PERIOD OF RECORD.--May 1938 to September 1945, June 1996 to September 1997, June 2001 to current year.
REVISIONS HISTORY.--Discharge for the period Aug. 18, 2021, to Oct. 10, 2024, was revised on June 25, 2025, based on changes to the stage-discharge rating.
GAGE.--Water-stage recorder. Datum of gage is 1,182.75 ft above NGVD of 1929 and 1,182.30 ft above NAVD of 1988. May 16, 1938 to Sept. 30, 1945, at site 4,200 ft downstream at datum 2.75 ft lower.
REMARKS.--Water Years 2014-24: Records good except those for estimated daily discharges, which are poor.
EXTREMES FOR PERIOD OF RECORD.--Maximum discharge, 4,300 ft³/s, May 16, 2014, gage height, 6.35 ft, present site and datum; maximum gage height, 6.43 ft, Oct. 30, 2021, present site and datum; maximum gage height for the period May 1938 to September 1945, 8.88 ft, Mar. 17, 1942, site and datum then in use; minimum discharge, 6.5 ft³/s, Sept. 28, 1941.
EXTREMES OUTSIDE PERIOD OF RECORD.--Flood of June 23, 1972, reached a stage of about 10.7 ft, present datum, at location 150 ft upstream from present site, from floodmark, discharge 13,300 ft³/s, on basis of contracted-opening measurement of peak flow.
 WaterAlert – get an
email or text (SMS) alert based on your chosen threshold.
WaterAlert – get an
email or text (SMS) alert based on your chosen threshold.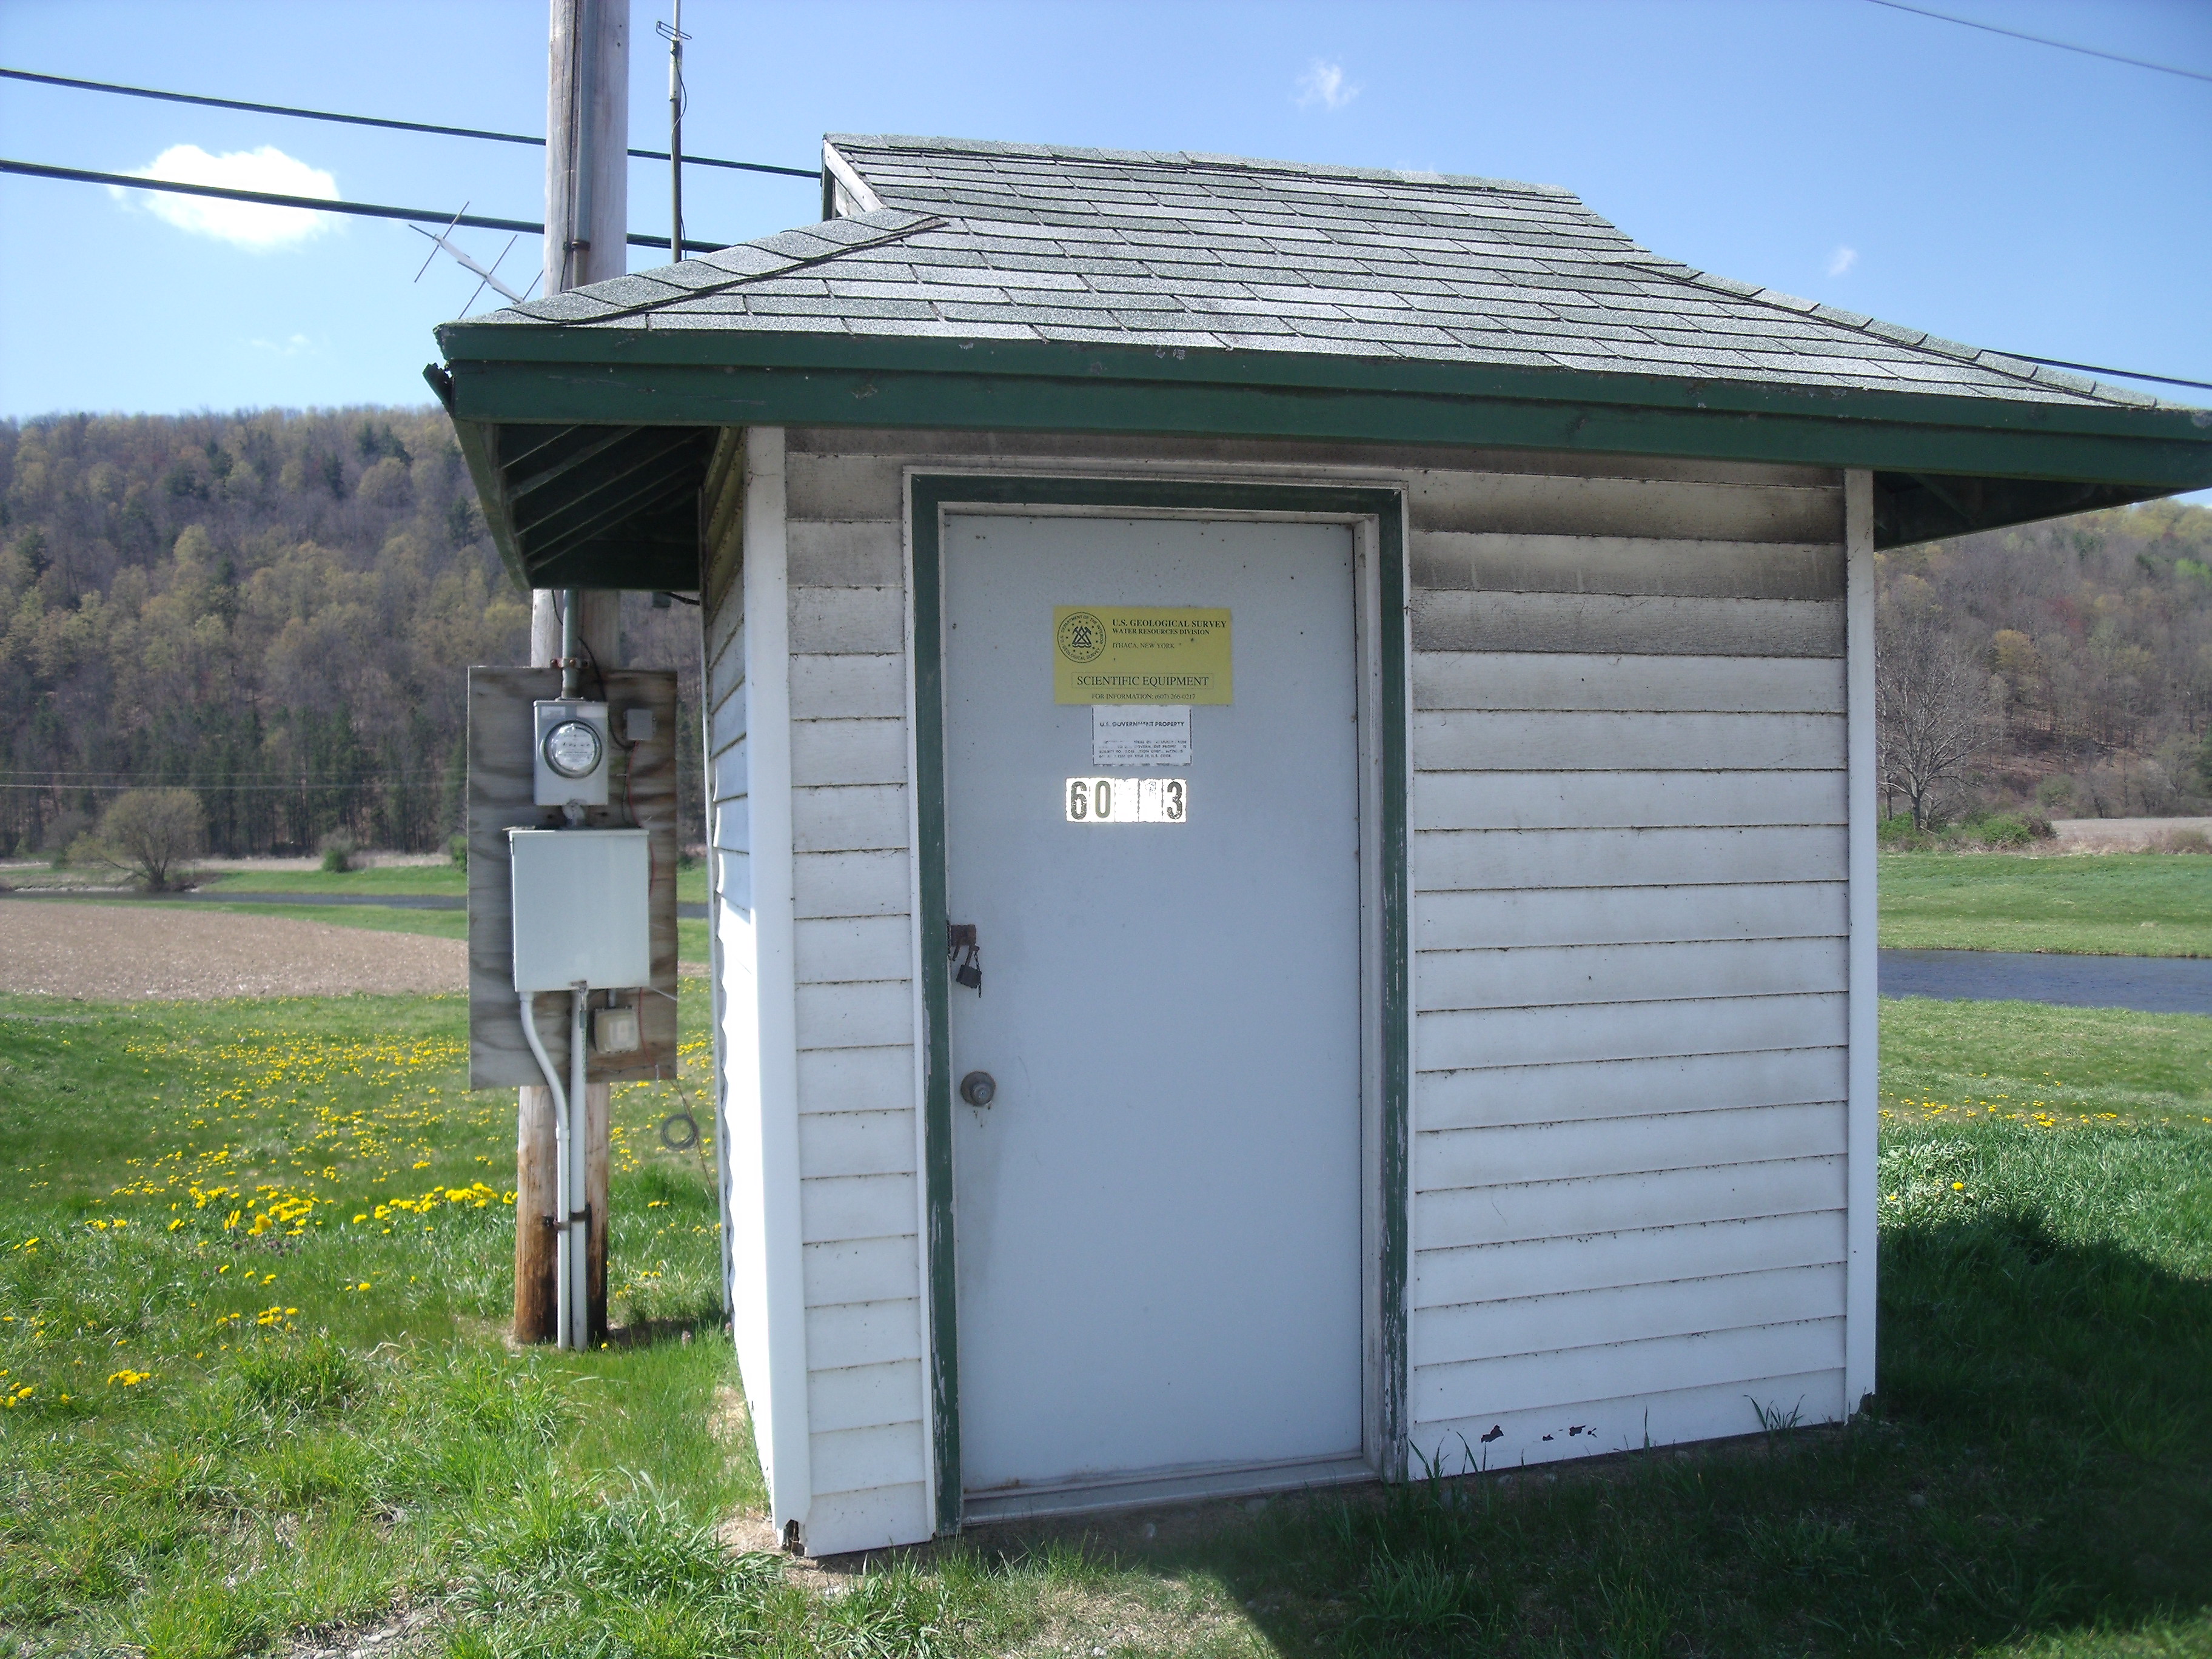 Station image
Summary of all available data for this site
Instantaneous-data availability statement

