PROVISIONAL DATA SUBJECT TO REVISION
Click to hidestation-specific text
Funding for this site is provided by:
 Site Information
LOCATION.--Lat 42°15'09", long
77°13'00" referenced to North American Datum of 1983,
Steuben County, NY, Hydrologic Unit 02050105, on left bank just
downstream from bridge on town road at junction with County
Highway 125, 1.9 mi upstream from Michigan Creek, and 2.0 mi
north of Campbell.
DRAINAGE AREA.--470 mi².
PERIOD OF RECORD.--July 1918 to current year.
REVISIONS HISTORY.--WSP 891: 1935. WSP 1302: 1919-20 (M), 1927-28 (M), 1928-38 (monthly runoff). WSP 2103: Drainage area.
GAGE.--Water-stage recorder. Datum of gage is 1,014.34 ft above NGVD of 1929 and 1,013.89 ft above NAVD of 1988. Prior to Oct. 1, 2020, at datum 2.00 ft higher. Prior to Mar. 5, 1937, nonrecording gage on highway bridge.
REMARKS.--From 1931-98, a large part of flow from 45.5 mi² of drainage area upstream from Lamoka Lake on Mud Creek, a tributary upstream from this station, had been diverted into Keuka Lake (Oswego River basin), for power development.
Water Years 2014-24: Records good except those for estimated daily discharges, which are poor.
EXTREMES FOR PERIOD OF RECORD.--Maximum discharge, 41,100 ft³/s, July 8, 1935, gage height, 13.6 ft, present datum, from floodmark, from rating curve extended above 25,000 ft³/s on basis of velocity-area and slope-area measurements of peak flow; minimum discharge, 8 ft³/s, Sept. 6, 7, 1934.
 WaterAlert – get an
email or text (SMS) alert based on your chosen threshold.
WaterAlert – get an
email or text (SMS) alert based on your chosen threshold.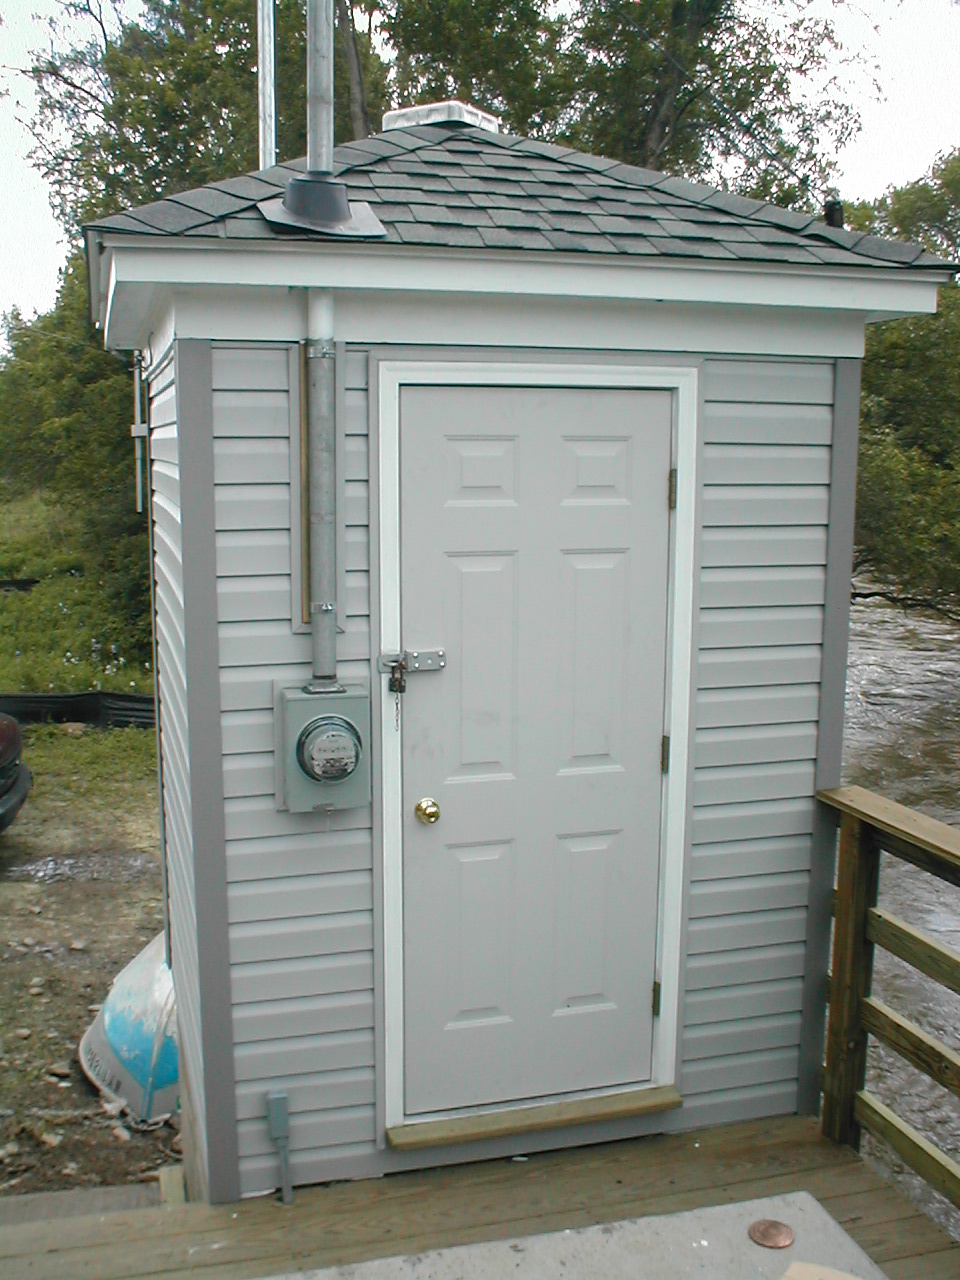 Station image
Summary of all available data for this site
Instantaneous-data availability statement

