PROVISIONAL DATA SUBJECT TO REVISION
Click to hidestation-specific text
Funding for this site is provided by:
 Site Information
LOCATION.--Lat 42°32'18.1", long
79°10'08.3" referenced to North American Datum of
1983, Chautauqua County, NY, Hydrologic Unit 04120101, on right
bank at bridge on State Highway 20, in village of Silver Creek,
0.5 miles upstream from confluence with Silver
Creek.
DRAINAGE AREA.--25.6 mi².
PERIOD OF RECORD.--September 2017 to current year.
GAGE.--Water-stage recorder and crest-stage gage. Datum of gage is 587.55 ft above NAVD of 1988.
REMARKS.--Water Years 2017-24: Records fair except those for estimated daily discharges, which are poor.
EXTREMES FOR PERIOD OF RECORD.--Maximum discharge, 4,070 ft³/s, Nov. 5, 2017, gage height, 9.05 ft, from rating curve extended above 500 ft³/s; minimum discharge, 0.44 ft³/s, Aug. 20, 2022, gage height 1.81 ft; minimum gage height, 1.78 ft, Mar. 18, 25, 2018.
 WaterAlert – get an
email or text (SMS) alert based on your chosen threshold.
WaterAlert – get an
email or text (SMS) alert based on your chosen threshold.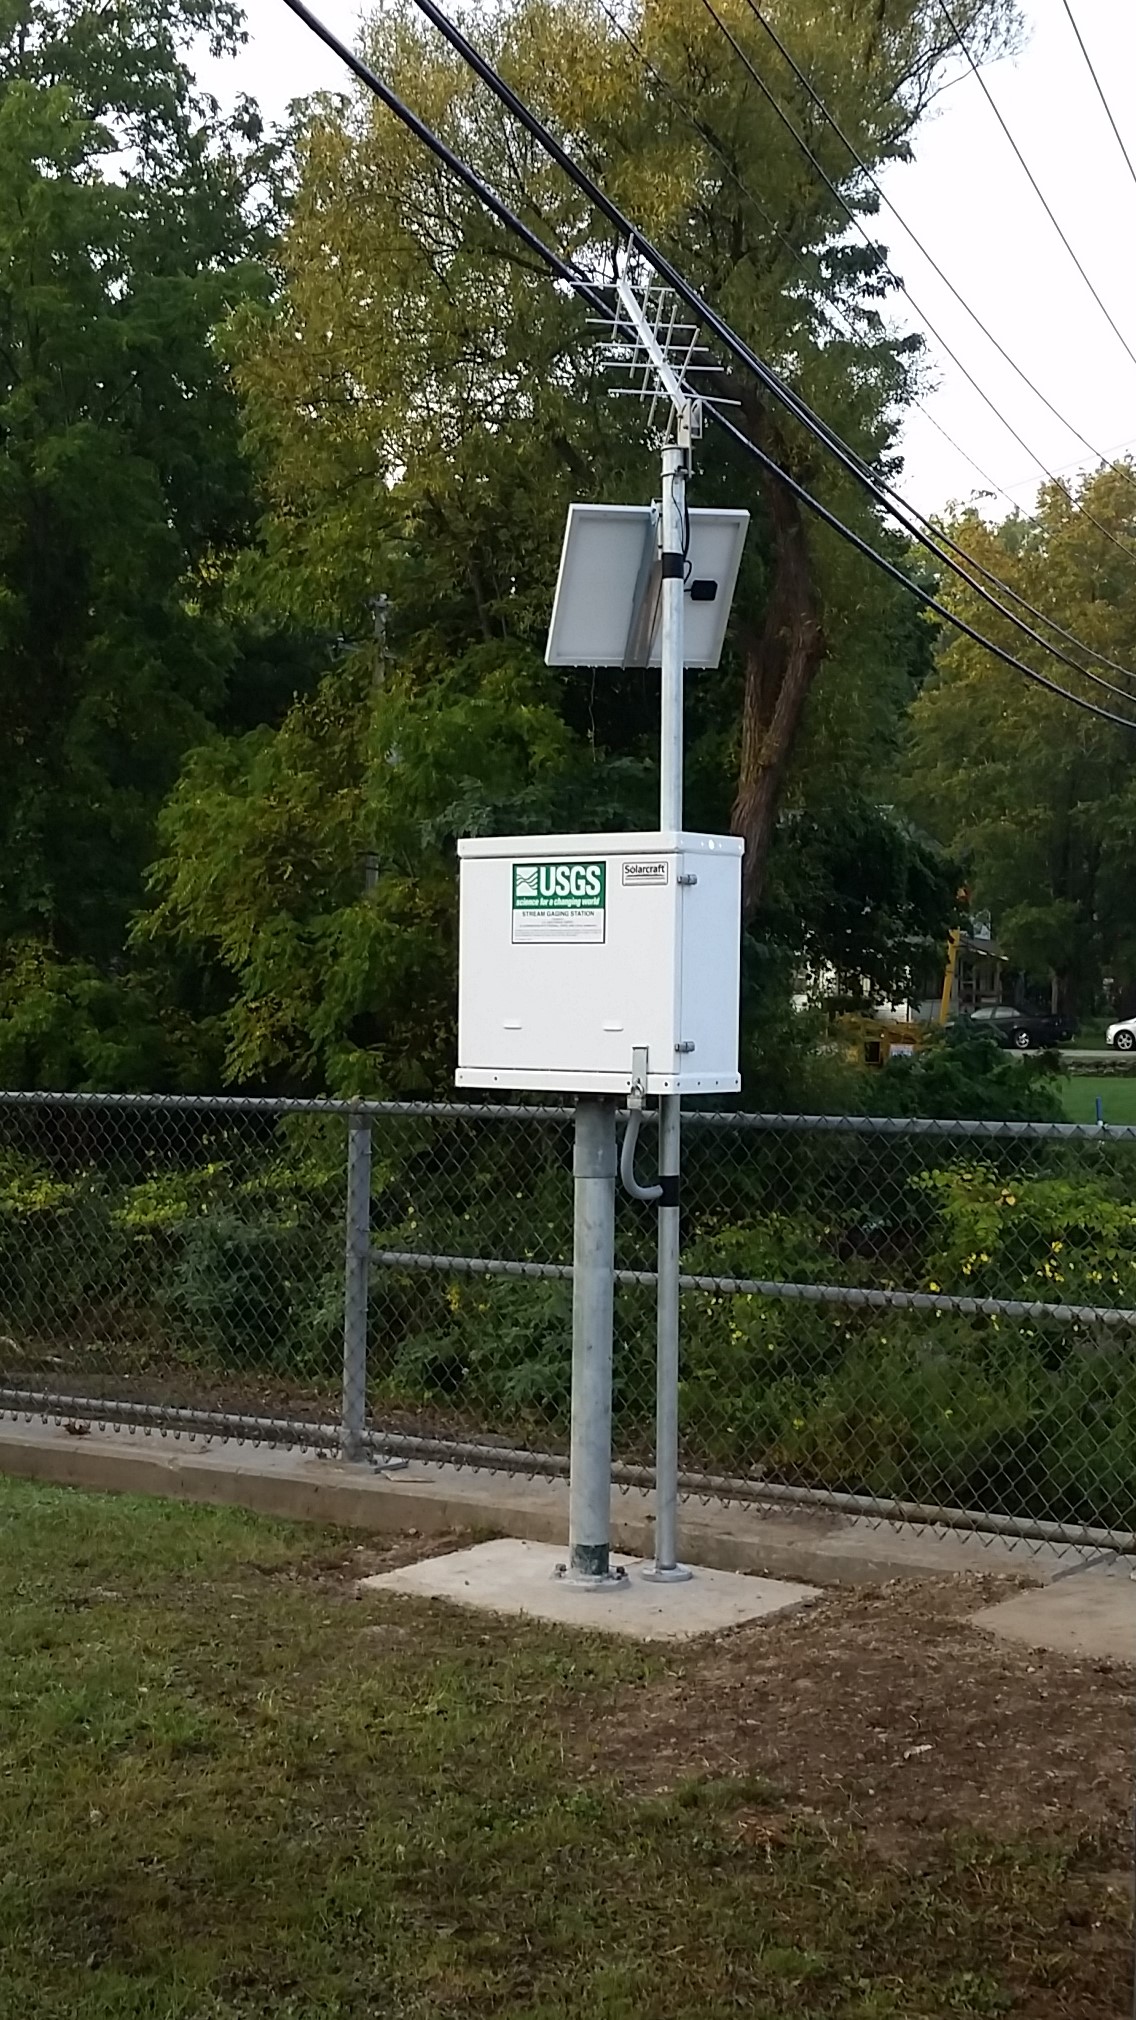 Station image
Summary of all available data for this site
Instantaneous-data availability statement

