PROVISIONAL DATA SUBJECT TO REVISION
Click to hidestation-specific text
Funding for this site is provided by:
 Site Information
LOCATION.--Lat 43°21'11.9", long
78°11'35.0" referenced to North American Datum of
1983, Orleans County, NY, Hydrologic Unit 04130001, on left
bank on downstream end of abandoned bridge pier of Oak Orchard
River Road bridge, 4.0 mi downstream from Waterport Reservoir
Dam, 1.7 mi upstream from mouth into Lake Ontario, and 7.4 mi
north of Albion.
DRAINAGE AREA.--272 mi².
PERIOD OF RECORD.--September 2020 to current year.
GAGE.--Acoustic velocity meter, water-stage recorder, and crest-stage gage. Datum of gage is 229.39 ft above NAVD of 1988 and 229.32 ft above IGLD of 1985.
REMARKS.--Flow regulated to some extent by Waterport hydroelectric reservoir 4.0 mi upstream from station and from Glenwood Lake hydroelectric reservoir 18.3 mi upstream from station. Discharge includes undetermined diversion from Erie (Barge) Canal, 14.8 mi upstream from station. Water Years 2020-24: Records fair except those for estimated daily discharges and those below 100 ft³/s, which are poor.
EXTREMES FOR PERIOD OF RECORD.--Maximum discharge, 5,680 ft³/s, Jan. 26, 2024, gage height, 16.79 ft; maximum gage height, 18.28 ft, May 13, 2023; minimum daily discharge, 50.4 ft³/s, July 26, 2023; minimum gage height, 14.43 ft, Nov. 17, 2024.
EXTREMES OUTSIDE PERIOD OF RECORD.--Flood in May 2017 reached an elevation of 19.66 ft, present datum (248.98 ft above IGLD of 1985), from floodmarks at Marsh Creek at mouth at The Bridges (station 0422018605).
PERIOD OF DAILY RECORD1.--WATER TEMPERATURE: October 2020 to current year. SPECIFIC CONDUCTANCE: October 2020 to current year. DISSOLVED OXYGEN: October 2020 to current year. TURBIDITY: October 2020 to current year.
INSTRUMENTATION1.--Multi-parameter water-quality sonde measures water temperature, specific conductance, dissolved oxygen, and turbidity at 15-minute intervals since October 2020.
EXTREMES FOR PERIOD OF DAILY RECORD1.--WATER TEMPERATURE: Maximum, 28.4°C, June 29, Aug. 26, 2021; minimum, -0.1°C, Mar. 1, 2, 5, 2021.
SPECIFIC CONDUCTANCE: Maximum, 1,120 uS/cm @ 25°C, Feb. 24, 25, 2025; minimum, 328 uS/cm @ 25°C, Aug. 16, 2023.
DISSOLVED OXYGEN: Maximum, 18.8 mg/L, June 18, 2022; minimum, 3.7 mg/L, Aug. 7, 2023.
TURBIDITY: Maximum, 229 FNU, June 8, 2021; minimum, 0.5 FNU, Aug. 25, 26, Sept. 21, 22, 2022.
1 Water-Quality Records
 WaterAlert – get an
email or text (SMS) alert based on your chosen threshold.
WaterAlert – get an
email or text (SMS) alert based on your chosen threshold.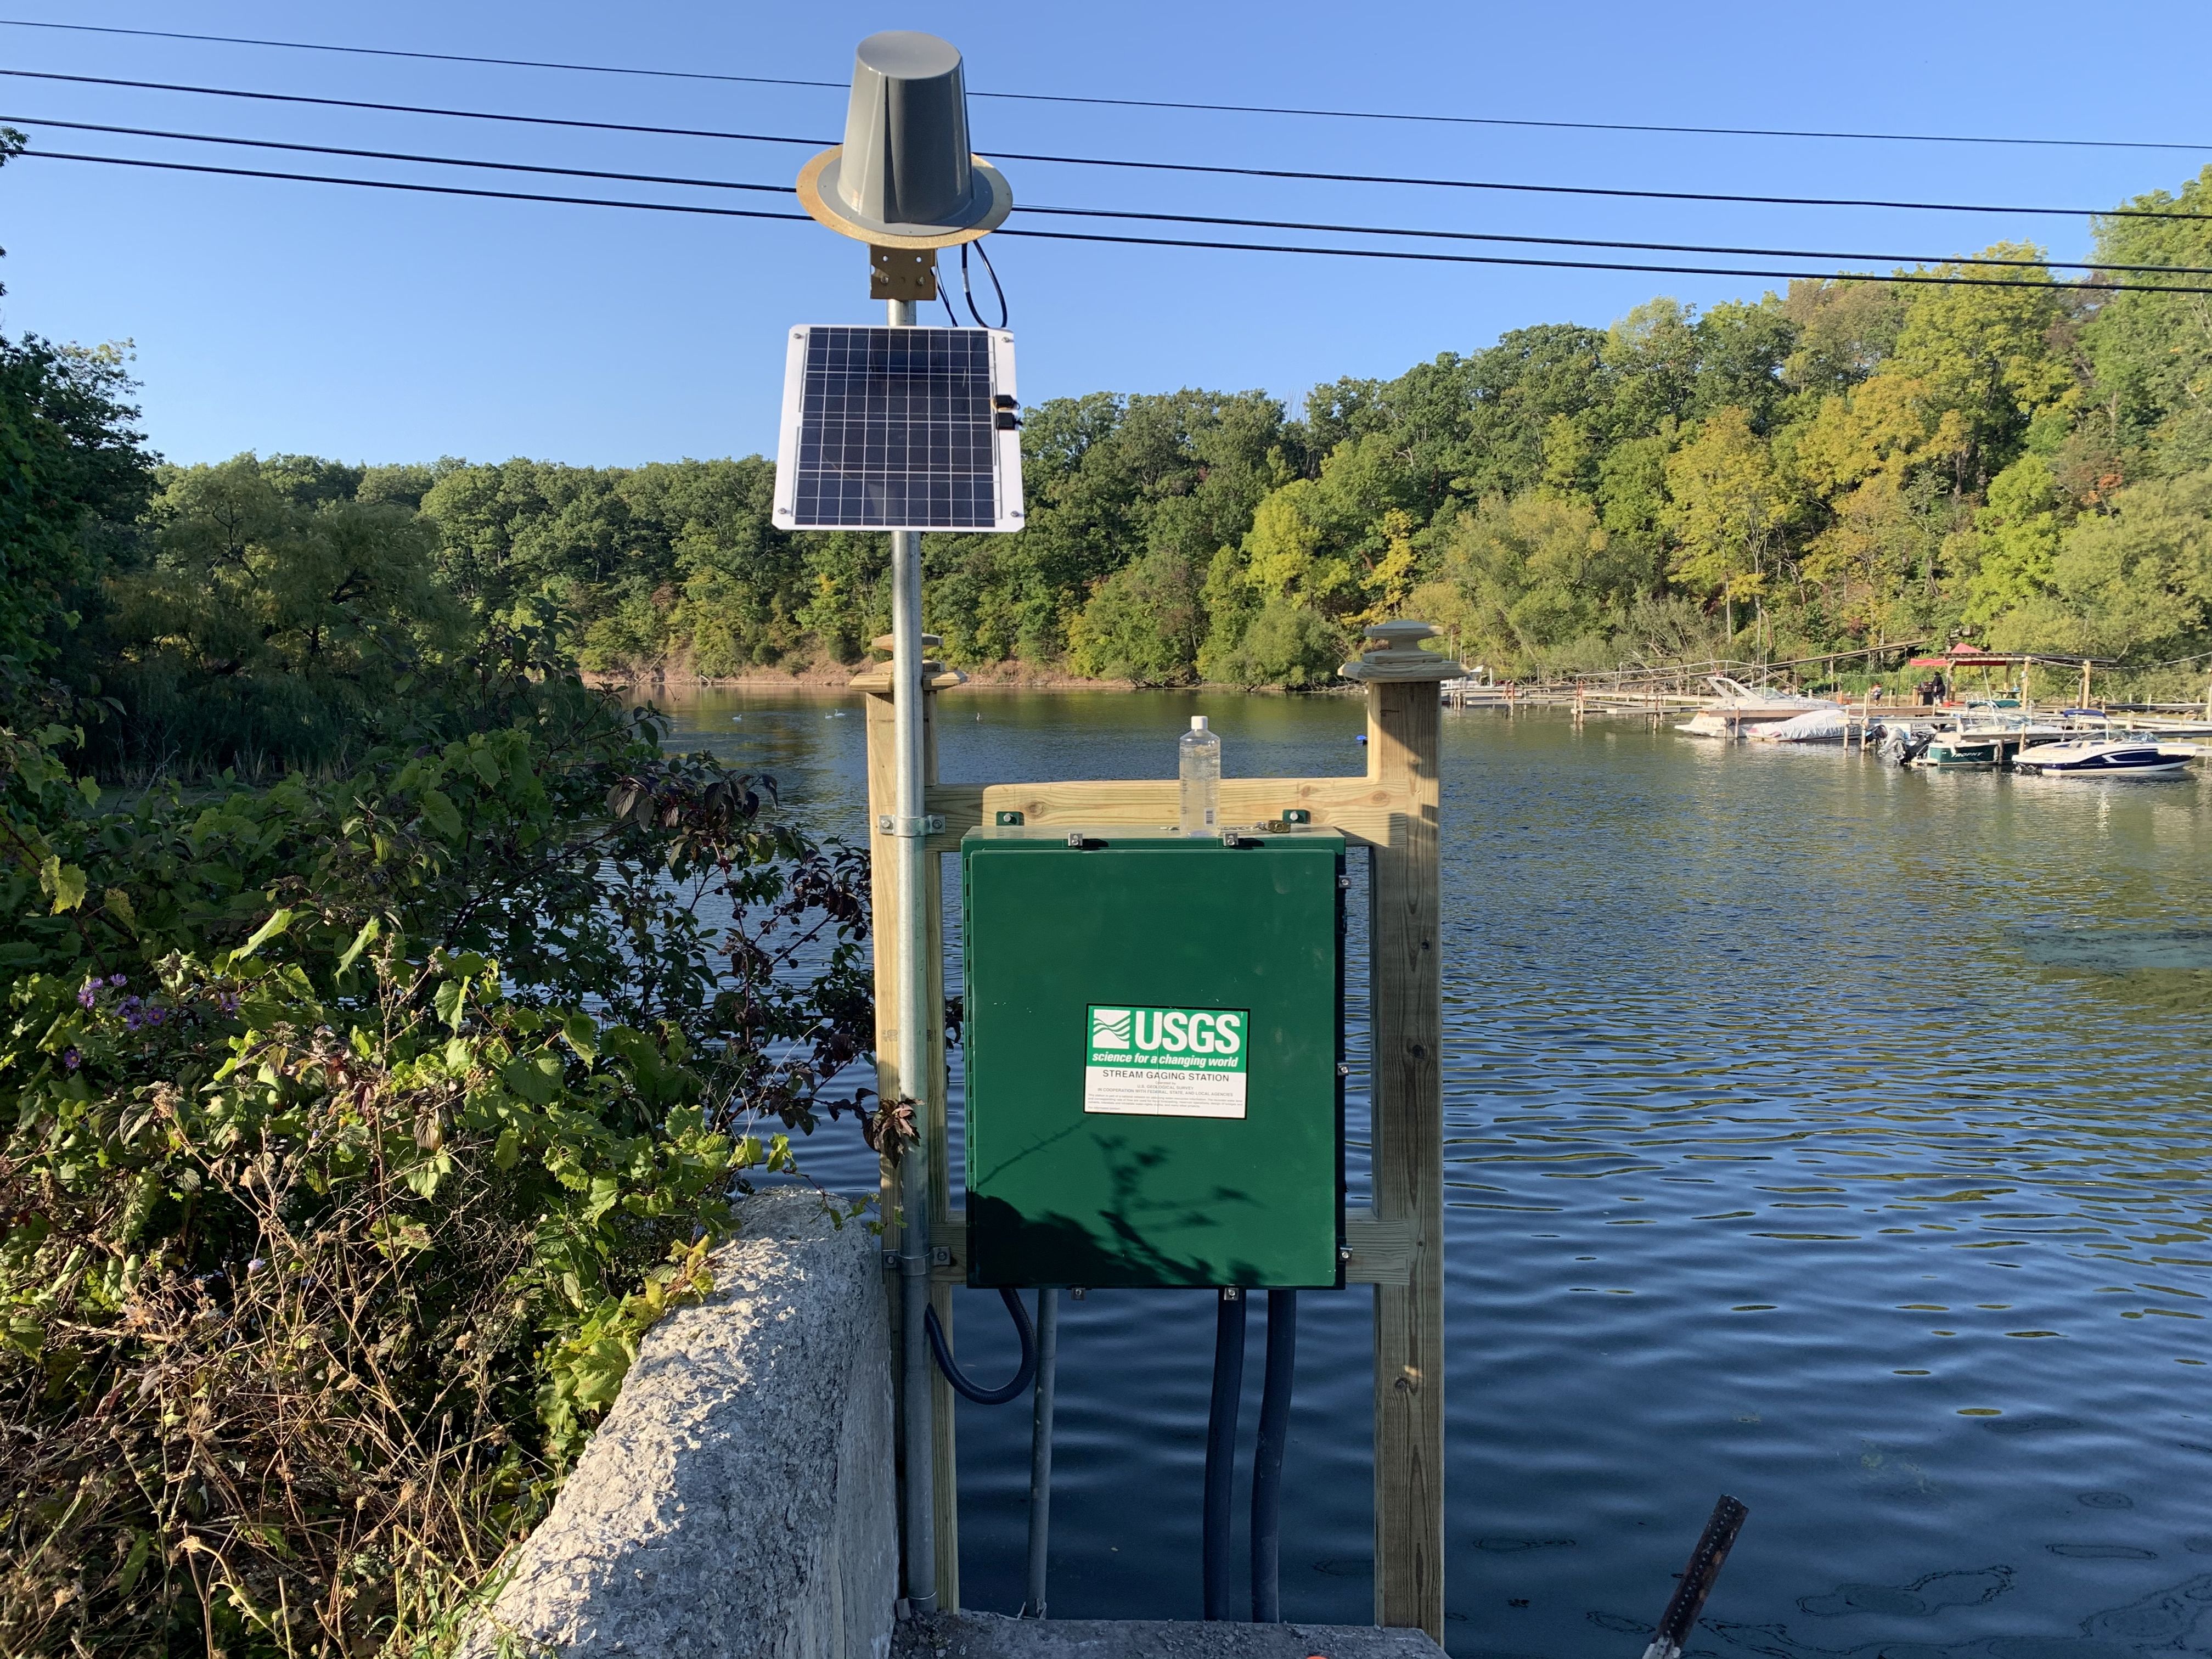 Station image
Summary of all available data for this site
Instantaneous-data availability statement

