PROVISIONAL DATA SUBJECT TO REVISION
Click to hidestation-specific text
Funding for this site is provided by:
 Site Information
LOCATION.--Lat 43°20'07.4", long
77°55'40.1" referenced to North American Datum of
1983, Monroe County, NY, Hydrologic Unit 04130001, on left bank
1.0 mi north of junction of Church Road and Lake Road West
Fork, 2.5 mi north of Hamlin.
DRAINAGE AREA.--85.8 mi².
PERIOD OF RECORD.--Occasional miscellaneous discharge measurements, water years 2015-17. October 2017 to current year.
GAGE.--Water-stage recorder and crest-stage gage. Datum of gage is 252.67 ft above NAVD of 1988. Prior to Mar. 12, 2025, at site 0.85 mi downstream at same datum.
REMARKS.--Discharge includes undetermined diversion from Erie (Barge) Canal upstream from station. Water Years 2018-19, 2021-24: Records good except those for estimated daily discharges, which are poor. Water Year 2020: Records fair except those for estimated daily discharges, which are poor.
EXTREMES FOR PERIOD OF RECORD.--Maximum discharge, about 2,350 ft³/s, Jan. 27, 2024, gage height, 13.36 ft, site then in use; maximum gage height, 16.83 ft, Feb. 5, 2019 (ice jam), site then in use; minimum discharge, 6.44 ft³/s, July 14, 2024, gage height, 9.06 ft, site then in use; minimum gage height, 8.79 ft, July 31, Aug. 1, 2020, site then in use.
PERIOD OF DAILY RECORD1.--WATER TEMPERATURE: July 2020 to current year. SPECIFIC CONDUCTANCE: July 2020 to current year. DISSOLVED OXYGEN: July 2020 to current year. TURBIDITY: July 2020 to current year.
INSTRUMENTATION1.--Multi-parameter water-quality sonde measures water temperature, specific conductance, dissolved oxygen, and turbidity at 15-minute intervals since July 2020.
EXTREMES FOR PERIOD OF DAILY RECORD1.--WATER TEMPERATURE: Maximum, 32.5°C, July 9, 10, 2020; minimum, -0.1°C, on many days.
SPECIFIC CONDUCTANCE: Maximum, 1,550 uS/cm @ 25°C, Feb. 5, 2023; minimum, 186 uS/cm @ 25°C, July 16, 2024.
DISSOLVED OXYGEN: Maximum, 20.8 mg/L, May 12, 2022; minimum, 2.9 mg/L, June 29, 2021, June 21, 2024.
TURBIDITY: Maximum, 686 FNU, Jan. 25, 2024; minimum, 0.0 FNU, May 31, 2022.
1 Water-Quality Records
 WaterAlert – get an
email or text (SMS) alert based on your chosen threshold.
WaterAlert – get an
email or text (SMS) alert based on your chosen threshold.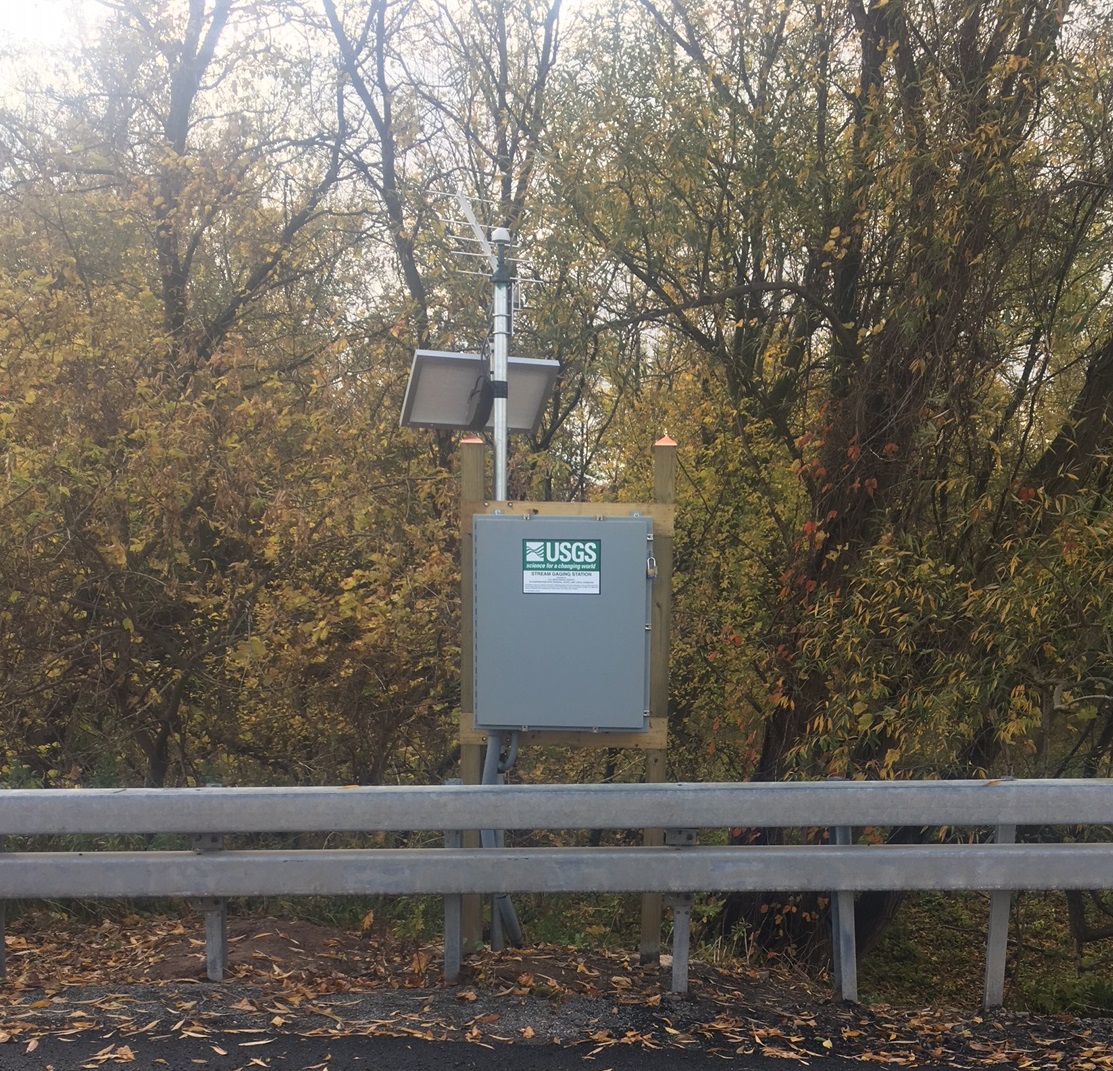 Station image
Summary of all available data for this site
Instantaneous-data availability statement

