PROVISIONAL DATA SUBJECT TO REVISION
Click to hidestation-specific text
Funding for this site is provided by:
 Site Information
LOCATION.--Lat 43°11'53.0", long
77°42'39.1" referenced to North American Datum of
1983, Monroe County, NY, Hydrologic Unit 04130001, near left
bank on downstream side of bridge on Straub Road, 0.4 mi
downstream from Round Pond Creek Dam discharge control
structure, 0.9 mi southwest of Greece, and 5.7 mi upstream from
Kirk Creek.
DRAINAGE AREA.--7.89 mi².
PERIOD OF RECORD.--May 2021 to current year.
GAGE.--Water-stage recorder and crest-stage gage. Datum of gage is 435.23 ft above NAVD of 1988.
REMARKS.--Considerable regulation of flow during storm events by manipulation of control structure at Round Pond Creek Dam 0.4 mi upstream. Water Years 2021-23: Records good except those for estimated daily discharges, which are poor.
EXTREMES FOR PERIOD OF RECORD.--Maximum discharge, 255 ft³/s, Jan. 26, 2024, gage height, 6.15 ft; minimum discharge, 0.45 ft³/s, Aug. 16, 17, 2024, gage height, 3.75 ft; minimum gage height, 3.73 ft, Sept. 11, 2021.
 WaterAlert – get an
email or text (SMS) alert based on your chosen threshold.
WaterAlert – get an
email or text (SMS) alert based on your chosen threshold.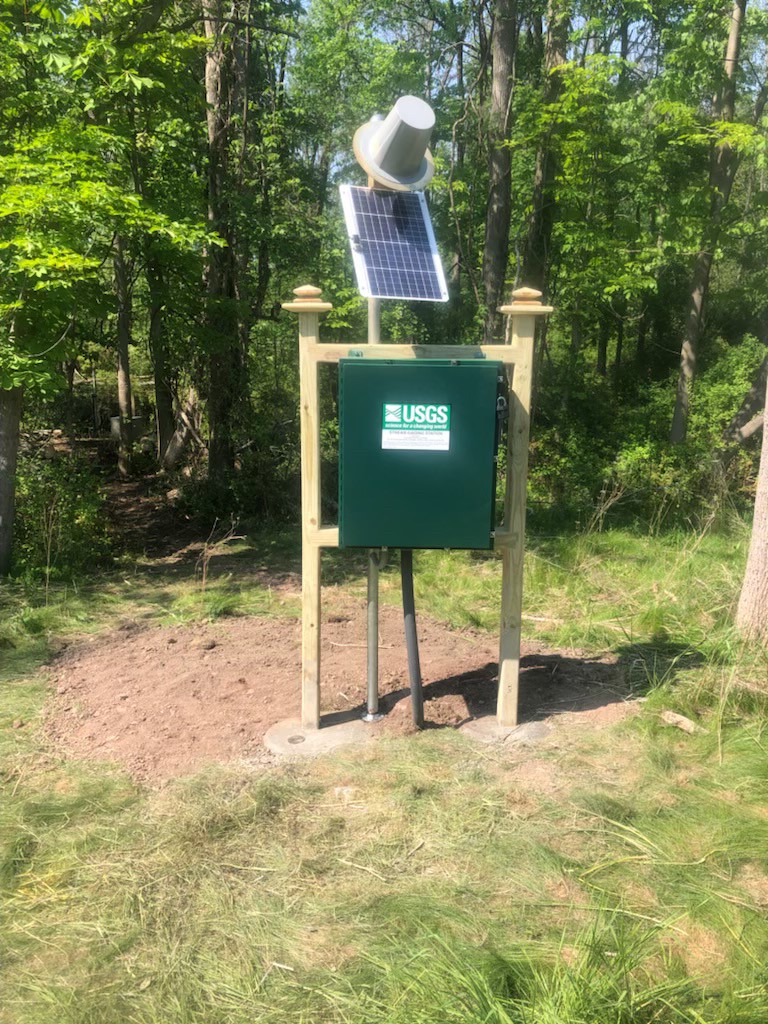 Station image
Summary of all available data for this site
Instantaneous-data availability statement

