PROVISIONAL DATA SUBJECT TO REVISION
Click to hidestation-specific text
 Site Information
LOCATION.--Lat 42°40'56.9", long
77°49'43.3" referenced to North American Datum of
1983, Livingston County, NY, Hydrologic Unit 04130002, on left
bank 290 feet upstream from bridge on State Highway 36, at
Sonyea.
DRAINAGE AREA.--68.3 mi².
PERIOD OF RECORD.--March 1911 to December 1913 (published as "at Sonyea"), September 1915 to December 1916 (published as "near Sonyea") seasonal records only. August 1917 to September 1932, November 1974 to September 1977, April 2016 to current year. Occasional discharge measurements, water years, 1954, 1957-62,1964, and 1965.
REVISIONS HISTORY.--WDR NY-75-1: Drainage area.
GAGE.--Water-stage recorder and crest-stage gage. Datum of gage is 581.76 ft above NAVD of 1988. November 1974 to September 1977, water-stage recorder at site 300 ft upstream at different datum. Prior to Sept. 30, 1932, nonrecording gages at different sites and datum.
REMARKS.--Precipitation data for this location is published under station 424057077494301 Keshequa Creek Rain Gage at Craig Colony at Sonyea, NY. Water Years 2016-24: Records fair except those for estimated daily discharges and those above 1,200 ft³/s, which are poor.
EXTREMES FOR PERIOD OF RECORD.--Maximum discharge, 6,280 ft³/s Sept. 25, 1977, gage height 6.69 ft, from rating curve extended above 600 ft³/s, site and datum then in use; maximum gage height since April 2016, 7.66 ft, Oct. 29, 2021; minimum discharge, about 0.1 ft³/s Sept. 8-21, 1932, at site then in use.
PERIOD OF DAILY RECORD1.--WATER TEMPERATURE: April 2016 to March 2019. SPECIFIC CONDUCTANCE: April 2016 to March 2019. pH: April 2016 to March 2019. DISSOLVED OXYGEN: April 2016 to March 2019. TURBIDITY: April 2016 to March 2019.
INSTRUMENTATION1.--Multi-parameter water-quality sonde measures water temperature, specific conductance, pH, dissolved oxygen, and turbidity at 15-minute intervals from April 2016 to March 2019.
EXTREMES FOR PERIOD OF DAILY RECORD1.--WATER TEMPERATURE: Maximum, 30.4°C, July 4, 2018; minimum, -0.1°C, Mar. 2, 4, 5, 17, 18, 2018, and many days in 2019. SPECIFIC CONDUCTANCE: Maximum, 604 uS/cm @ 25°C, Nov. 23, 2016; minimum, 168 uS/cm @ 25°C, Apr. 20, 2017. pH: Maximum, 8.9, Mar. 24, 26, 2018; minimum, 7.6, June 15, 16, 2017. DISSOLVED OXYGEN: Maximum, 15.3 mg/L, Mar. 13, 2017, Mar. 25, 2018; minimum, 6.2 mg/L, Aug. 5, 6, 13, 2016. TURBIDITY: Maximum, 3770 FNU, June 15, 2017; minimum, 0.0 FNU, on many days in 2018.
1 Water-Quality Records
 WaterAlert – get an
email or text (SMS) alert based on your chosen threshold.
WaterAlert – get an
email or text (SMS) alert based on your chosen threshold.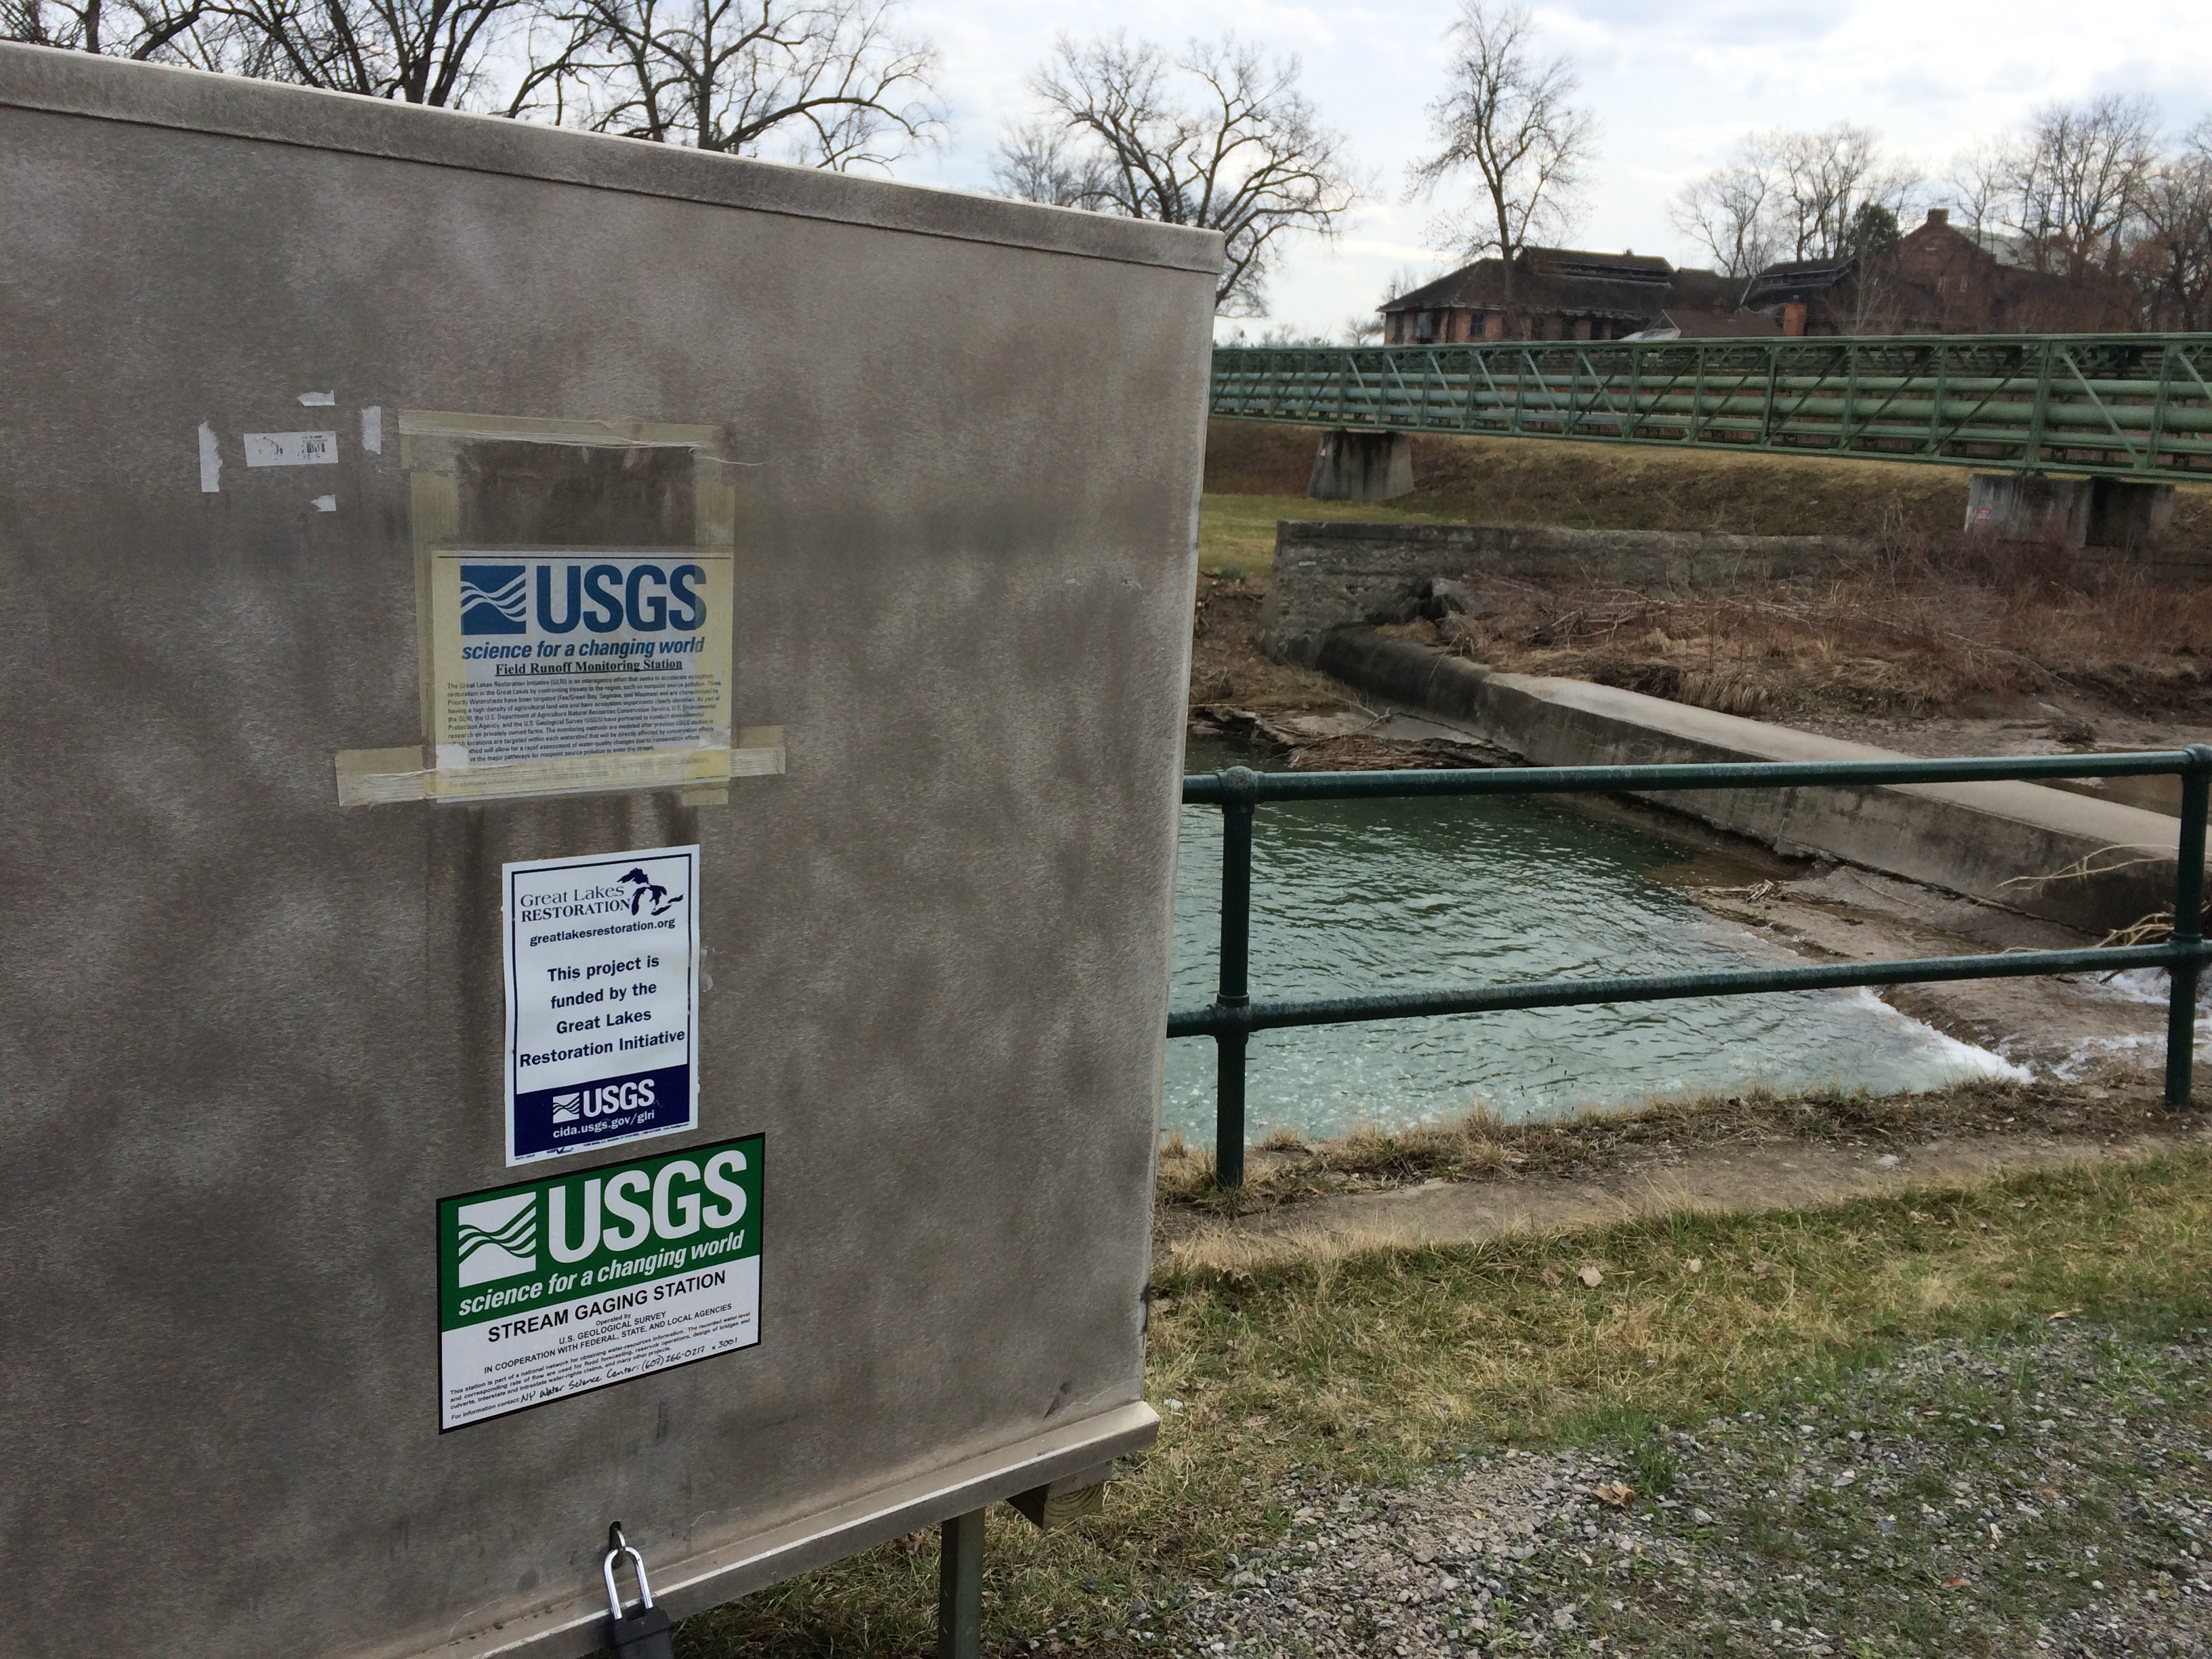 Station image
Instantaneous-data availability statement

