PROVISIONAL DATA SUBJECT TO REVISION
Click to hidestation-specific text
 Site Information
LOCATION.--Lat 42°22'53", long
76°23'40" referenced to North American Datum of 1983,
Tompkins County, NY, Hydrologic Unit 04140201, on left bank
1,000 ft upstream from bridge on Valley Road in Brooktondale
and 6.5 mi southeast of Ithaca.
DRAINAGE AREA.--27 mi².
PERIOD OF RECORD.--November 2002 to February 2024.
REVISIONS HISTORY.--WDR-US-2012: 2011(m).
GAGE.--Water-stage recorder. Datum of gage is 909.90 ft above NAVD of 1988.
REMARKS.--Water Years 2014-24: Records fair except those for estimated daily discharges, which are poor.
EXTREMES FOR PERIOD OF RECORD.--Maximum discharge, 4,470 ft³/s, Sept. 8, 2011, gage height, 5.38 ft, from rating curve extended above 1,500 ft³/s on basis of slope-area measurement at gage height 4.16 ft; minimum discharge, 1.8 ft³/s, Sept. 25, 2020; minimum gage height, 0.31 ft, July 29, 2016.
PERIOD OF DAILY RECORD1.--SUSPENDED-SEDIMENT CONCENTRATION: Water years 2003 to current year. SUSPENDED-SEDIMENT DISCHARGE: Water years 2003 to current year.
INSTRUMENTATION1.--Automatic water sampler since February 2003.
COOPERATION1.--Periodic water-quality samples were collected by personnel from the City of Ithaca Department of Public Works (Water and Sewer Division) and Tompkins County Soil and Water Conservation District. Samples are analyzed by personnel from the City of Ithaca Department of Public Works (Water and Sewer Division).
EXTREMES FOR PERIOD OF RECORD1.--SUSPENDED-SEDIMENT CONCENTRATION: Maximum daily mean, 5,230 mg/L, May 16, 2014; minimum daily mean, less than or equal to 1 mg/L on many days in 2003-15. SUSPENDED-SEDIMENT DISCHARGE: Maximum daily, 15,200 tons, June 27, 2006; minimum daily, 0.01 tons on many days in 2005-12, Oct. 1, 2013, Nov. 2-5, 2014.
1 Water-Quality Records
 WaterAlert – get an
email or text (SMS) alert based on your chosen threshold.
WaterAlert – get an
email or text (SMS) alert based on your chosen threshold.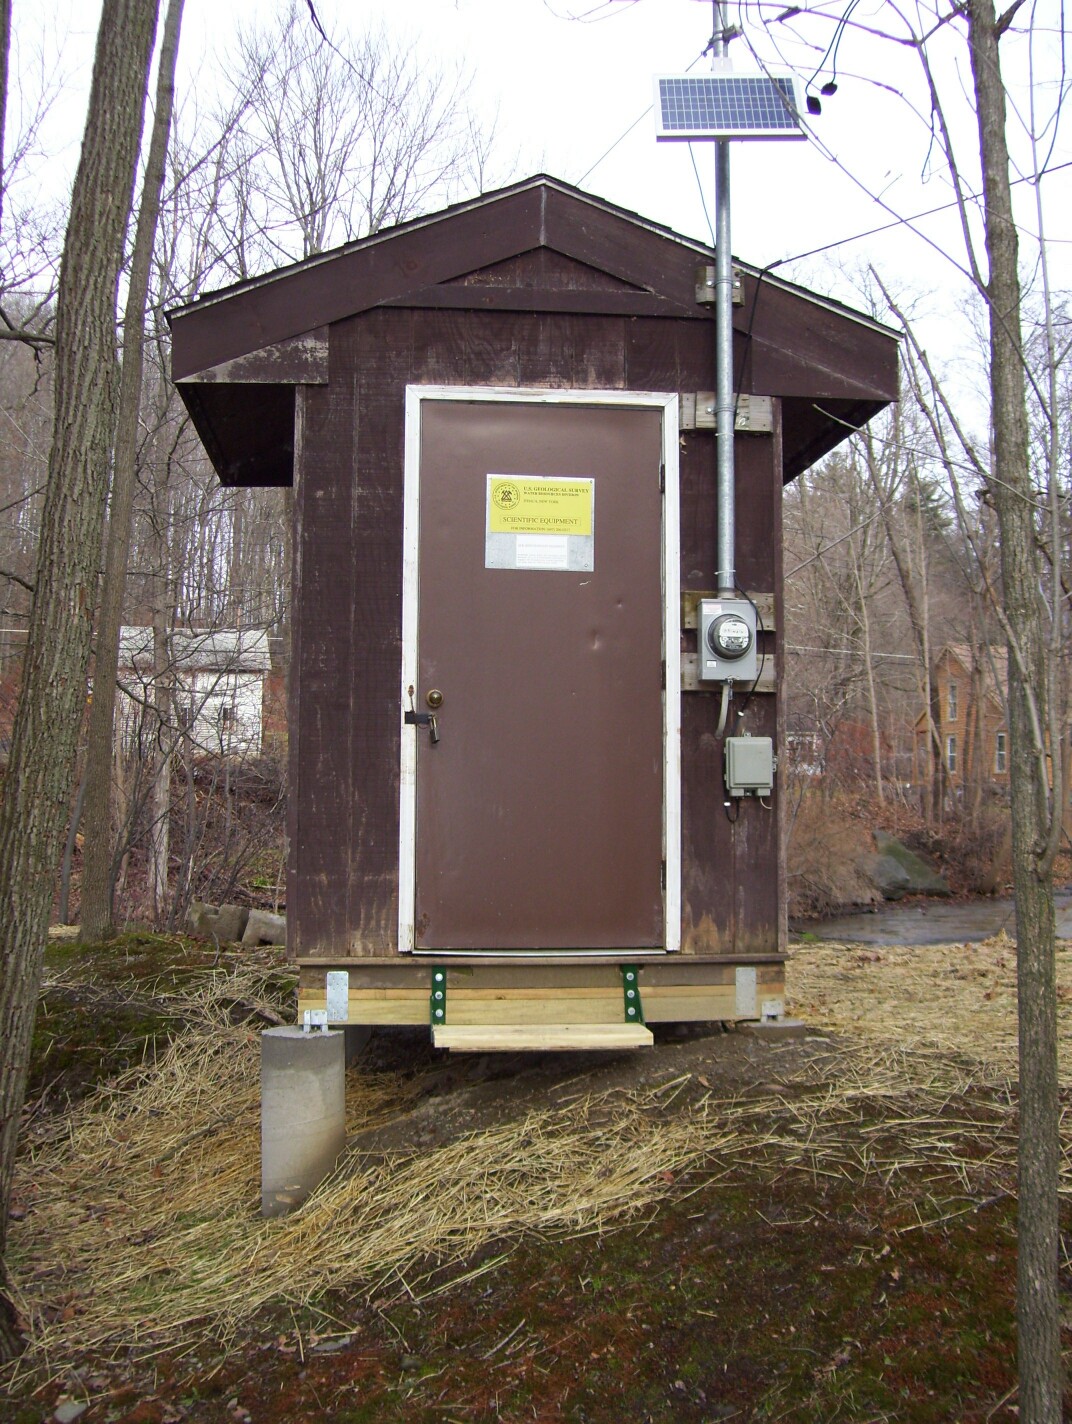 Station image
Summary of all available data for this site
Instantaneous-data availability statement