PROVISIONAL DATA SUBJECT TO REVISION
Click to hidestation-specific text
Funding for this site is provided by:
 Site Information
LOCATION.--Lat 42°33'09.4", long
76°32'01.8" referenced to North American Datum of
1983, Tompkins County, NY, Hydrologic Unit 04140201, on right
bank, at cul-de-sac of Mill Street in Ludlowville, 0.1 mi
downstream of Dug Street bridge, and 1.6 mi upstream of
mouth.
DRAINAGE AREA.--87.7 mi².
PERIOD OF RECORD.--July 2006 to September 2009, February 2013 to current year.
REVISIONS HISTORY.--2009 (Date of peak). 2015 (M).
GAGE.--Water-stage recorder and crest-stage gage. Datum of gage is 418.00 ft above NAVD of 1988.
REMARKS.--Water Years 2014-16: Records good except those for estimated daily discharges, which are fair. Water Years 2017-23: Records fair except those for estimated daily discharges and those below 1.0 ft³/s, which are poor.
EXTREMES FOR PERIOD OF RECORD.--Maximum discharge, 8,040 ft³/s, Aug. 19, 2021, gage height, 5.36 ft; maximum gage height, 6.26 ft, Feb. 17, 2022 (ice jam); minimum discharge, 0.27 ft³/s, Aug. 22, 2020, gage height, 0.05 ft.
PERIOD OF DAILY RECORD1.--SUSPENDED-SEDIMENT CONCENTRATION: April 2007 to September 2009. SUSPENDED-SEDIMENT DISCHARGE: April 2007 to September 2009.
COOPERATION1.--Samples were analyzed by personnel from the City of Ithaca Department of Public Works (Water and Sewer Division).
EXTREMES FOR PERIOD OF DAILY RECORD1.--SEDIMENT CONCENTRATION: Maximum daily mean, 2,000 mg/L, Dec. 23, 2007; minimum daily mean, 1 mg/L on several days in 2008 and 2009. SEDIMENT LOAD: Maximum daily, 17,900 tons, Dec. 23, 2007; minimum daily 0.02 tons on several days in 2008.
1 Water-Quality Records
 WaterAlert – get an
email or text (SMS) alert based on your chosen threshold.
WaterAlert – get an
email or text (SMS) alert based on your chosen threshold.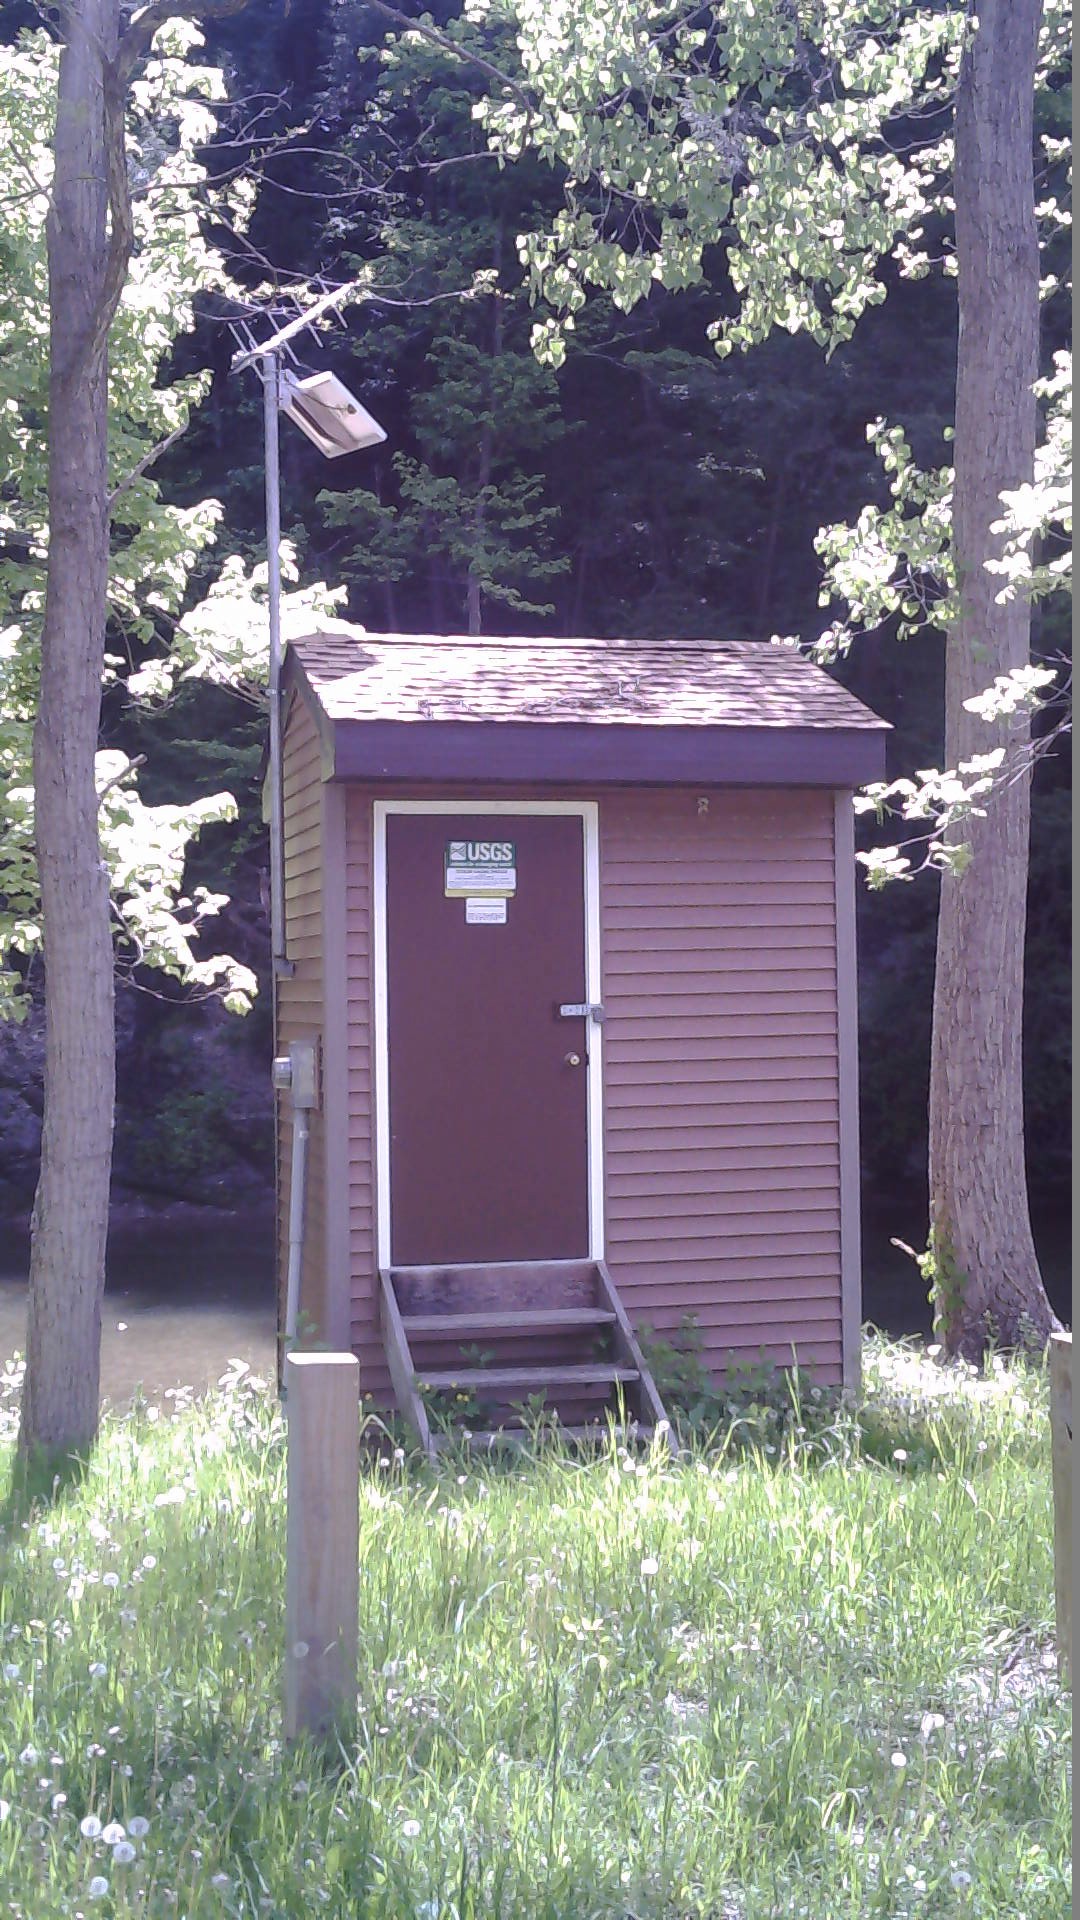 Station image
Summary of all available data for this site
Instantaneous-data availability statement

