PROVISIONAL DATA SUBJECT TO REVISION
Click to hidestation-specific text
 Site Information
LOCATION.--Lat 43°04'57.3", long
76°52'39.1" referenced to North American Datum of
1983, Wayne County, NY, Hydrologic Unit 04140201, on right bank
0.3 mi upstream from Mill Street bridge, 0.4 mi southwest of
Clyde, and 2.7 mi upstream from Lock E26 of the Erie
Canal.
DRAINAGE AREA.--833 mi².
PERIOD OF RECORD.--November 2021 to current year.
GAGE.--Acoustic velocity meter, water-stage recorder, and crest-stage gage. Datum of gage is 370.00 ft above NAVD of 1988.
REMARKS.--Clyde River basin receives water from the Erie (Barge) Canal 1.2 mi upstream from this station. A large amount of natural storage and some regulation is afforded by many lakes and the operation of the Erie (Barge) Canal in the river basin. Flow slightly regulated by Lock E27 of the Erie Canal 9.5 mi upstream from station and Lock E26 of the Erie Canal 2.7 mi downstream from station. Flow occasionally reversed as a result of wind affect.
Water Year 2022: Records fair except those for estimated daily discharges and those below 400 ft³/s, which are poor.
EXTREMES FOR PERIOD OF RECORD.--Maximum discharge, 6,120 ft³/s, Feb. 24, 2022, gage height, 16.25 ft; maximum gage height, 16.27 ft, Feb. 24, 2022, Apr. 7, 2023; minimum daily discharge, 23.7 ft³/s, Feb. 4, 2022; minimum gage height, 5.76 ft, Nov. 27, 2022.
 WaterAlert – get an
email or text (SMS) alert based on your chosen threshold.
WaterAlert – get an
email or text (SMS) alert based on your chosen threshold.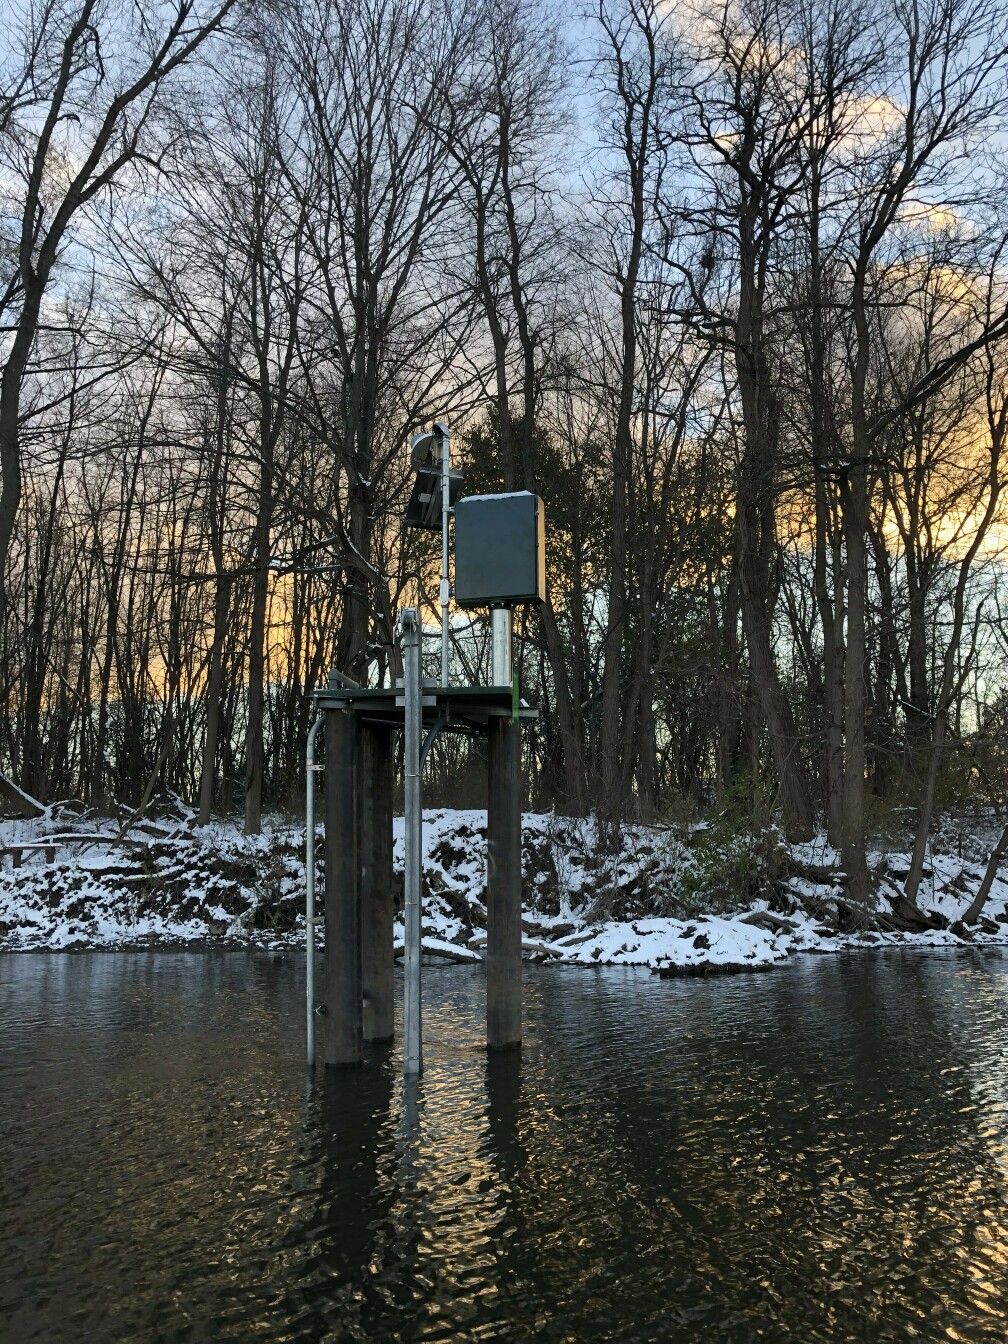 Station image
Summary of all available data for this site
Instantaneous-data availability statement

