PROVISIONAL DATA SUBJECT TO REVISION
Click to hidestation-specific text
 Site Information
LOCATION.--Lat 43°03'26.8", long
76°09'43.2" referenced to North American Datum of
1983, Onondaga County, NY, Hydrologic Unit 04140201, on right
bank 310 ft upstream from bridge on Spencer Street in Syracuse,
1,200 ft upstream from Erie (Barge) Canal terminal, and 1.0 mi
upstream from mouth.
DRAINAGE AREA.--110 mi².
PERIOD OF RECORD.--Occasional discharge measurements, water years 1958-70. September 1970 to current year.
REVISIONS HISTORY.--WDR NY-72-1: 1971 (M). WDR NY-75-1: 1972 (M), 1974 (M). WDR NY-81-3: Drainage area. WDR NY-89-3: 1971-72(M), 1974-80 (M), 1982-84 (M), 1986 (M), 1988 (M).
GAGE.--Water-stage recorder, crest-stage gage, and concrete control. Datum of gage is 362.29 ft above NGVD of 1929 (New York State Barge Canal benchmark) and 361.56 ft above NAVD of 1988.
REMARKS.--High flows regulated by Onondaga Reservoir. Flow may be affected by backwater from Onondaga Lake at times when the lake elevation exceeds 365.00 ft.
Water Years 2014-24: Records good except those for estimated daily discharges, which are poor.
EXTREMES FOR PERIOD OF RECORD.--Maximum discharge, 4,050 ft³/s, July 3, 1974, gage height, 8.73 ft, from rating curve extended above 1,700 ft³/s on basis of runoff comparisons with nearby stations; minimum discharge, 20 ft³/s, Sept. 26, 1985, gage height, 2.16 ft.
 WaterAlert – get an
email or text (SMS) alert based on your chosen threshold.
WaterAlert – get an
email or text (SMS) alert based on your chosen threshold.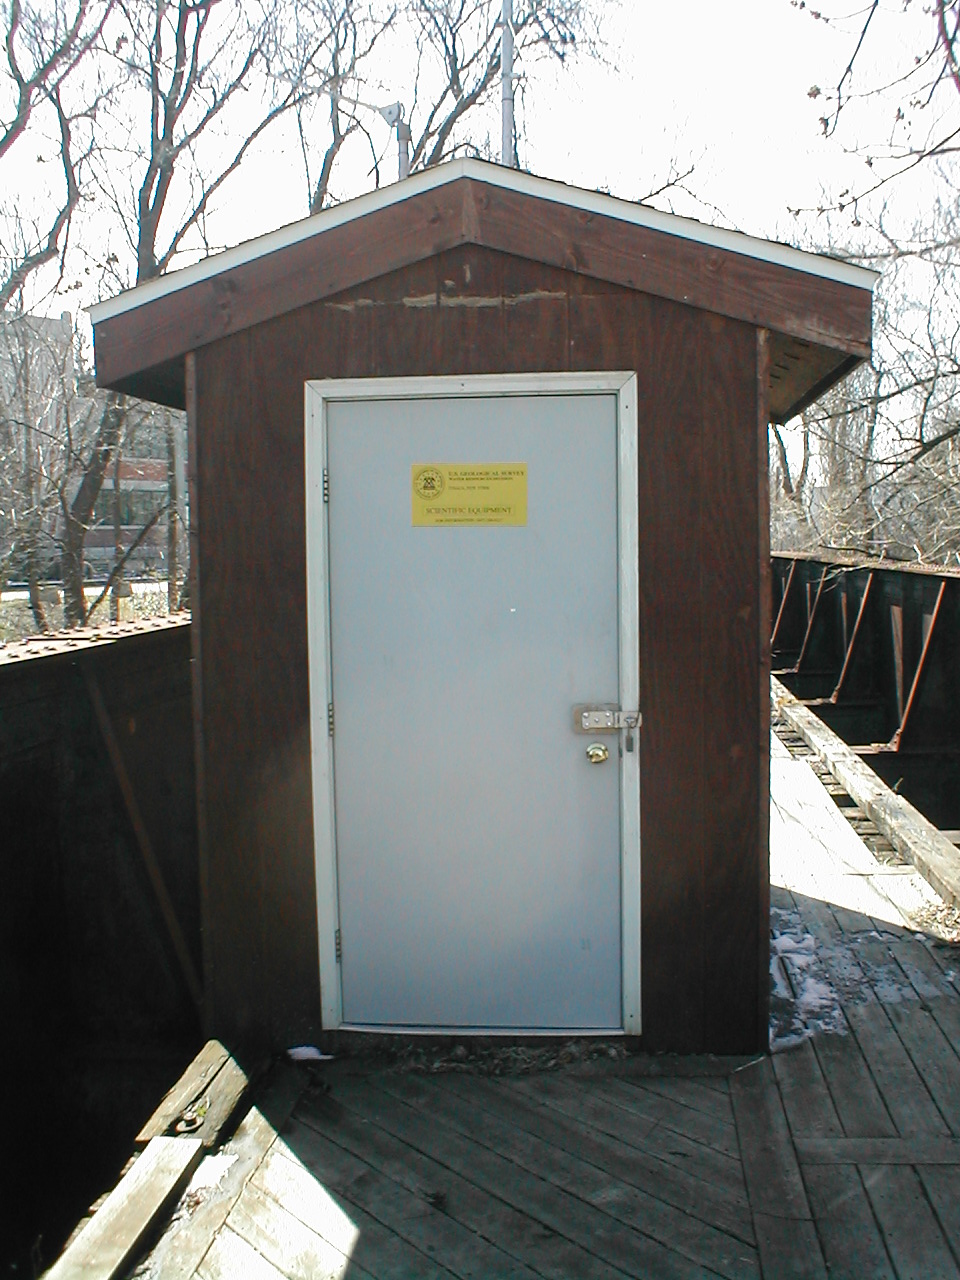 Station image
Summary of all available data for this site
Instantaneous-data availability statement

