PROVISIONAL DATA SUBJECT TO REVISION
Click to hidestation-specific text
Funding for this site is provided by:
 Site Information
LOCATION.--Lat 43°53'49.8", long
75°24'15.4" referenced to North American Datum of
1983, Lewis County, NY, Hydrologic Unit 04150101, on left bank
1,200 ft upstream from Black Creek, and 0.5 mi west of
Croghan.
DRAINAGE AREA.--291 mi².
PERIOD OF RECORD.--September 1930 to current year.
REVISIONS HISTORY.--WDR NY-82-1: Drainage area.
GAGE.--Water-stage recorder and crest-stage gage. Datum of gage is 806.20 ft above NGVD of 1929 and 805.87 ft above NAVD of 1988.
REMARKS.--Flow regulated by Stillwater Reservoir (station 04256500). Between Stillwater Dam and this station, flow is further regulated by several powerplant ponds. Diurnal fluctuation at low and medium flow.
Water Years 2014-24: Records good except those for estimated daily discharges, which are poor.
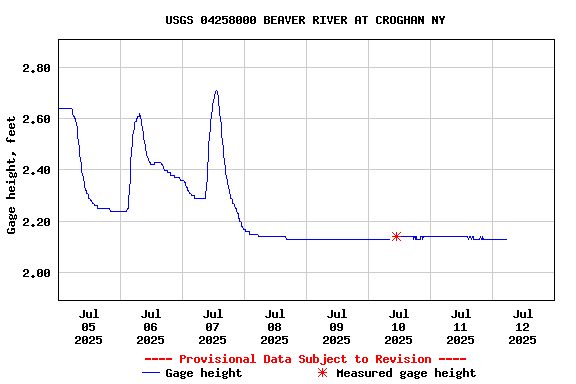
EXTREMES FOR PERIOD OF RECORD.--Maximum discharge, 5,100 ft³/s, May 21, 1969, gage height, 6.98 ft; minimum discharge, 11 ft³/s, Jan. 22, 29, Feb. 4, 1967, gage height, 0.63 ft.
DRAINAGE AREA.--291 mi².
PERIOD OF RECORD.--September 1930 to current year.
REVISIONS HISTORY.--WDR NY-82-1: Drainage area.
GAGE.--Water-stage recorder and crest-stage gage. Datum of gage is 806.20 ft above NGVD of 1929 and 805.87 ft above NAVD of 1988.
REMARKS.--Flow regulated by Stillwater Reservoir (station 04256500). Between Stillwater Dam and this station, flow is further regulated by several powerplant ponds. Diurnal fluctuation at low and medium flow.
Water Years 2014-24: Records good except those for estimated daily discharges, which are poor.
EXTREMES FOR PERIOD OF RECORD.--Maximum discharge, 5,100 ft³/s, May 21, 1969, gage height, 6.98 ft; minimum discharge, 11 ft³/s, Jan. 22, 29, Feb. 4, 1967, gage height, 0.63 ft.
 WaterAlert – get an
email or text (SMS) alert based on your chosen threshold.
WaterAlert – get an
email or text (SMS) alert based on your chosen threshold. Station image
Summary of all available data for this site
Instantaneous-data availability statement