PROVISIONAL DATA SUBJECT TO REVISION
Click to hidestation-specific text
Funding for this site is provided by:
 Site Information
LOCATION.--Lat 44°35'58", long
75°22'44" referenced to North American Datum of 1983,
St. Lawrence County, NY, Hydrologic Unit 04150302, on right
bank 1.5 mi downstream from Beaver Creek, and 2.5 mi upstream
from Heuvelton.
DRAINAGE AREA.--986 mi².
PERIOD OF RECORD.--June 1916 to current year.
REVISIONS HISTORY.--WDR NY-82-1: Drainage area.
GAGE.--Water-stage recorder and crest-stage gage. Datum of gage is 288.85 ft above NGVD of 1929 and 287.68 ft above NAVD of 1988. Prior to Sept. 16, 1916, nonrecording gage at same site and datum.
REMARKS.--Entire flow regulated by Cranberry Lake (station 04260990); slight diurnal fluctuation at low flow and medium flow caused by powerplants. During high stages on Grass River, part of flow of that stream may pass through Upper Lake, Indian Creek, and Lower Lake and enter Oswegatchie River at Rensselaer Falls, 4.5 mi upstream from station. In October 1973, a dike was installed on Indian Creek to prevent overflow of Grass River during high flows.
Water Years 2014-24: Records good except those for estimated daily discharges, which are poor.
EXTREMES FOR PERIOD OF RECORD.--Maximum discharge, 19,600 ft³/s, Apr. 6, 1960, gage height, 10.36 ft; minimum discharge, about 90.8 ft³/s, Sept. 27, 2020, gage height, 0.33 ft, but may have been lower during period of no gage-height record Sept. 7, 1960, Sept. 27, 28, 2020.
 WaterAlert – get an
email or text (SMS) alert based on your chosen threshold.
WaterAlert – get an
email or text (SMS) alert based on your chosen threshold.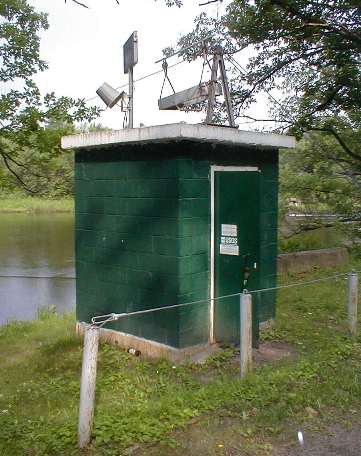 Station image
Summary of all available data for this site
Instantaneous-data availability statement

![Graph of Gage height, feet, [Published]](https://nadww02.cr.usgs.gov/nwisweb/data/img/USGS.04263000.107805.00065..20250705.20250712..0..gif)