PROVISIONAL DATA SUBJECT TO REVISION
Click to hidestation-specific text
 Site Information
LOCATION.--Lat 44°40'54", long
73°28'16" referenced to North American Datum of 1983,
Clinton County, NY, Hydrologic Unit 04150406, on right bank at
Plattsburgh, 600 ft downstream from dam, 3.0 mi upstream from
mouth, and 5.5 mi downstream from Mead Brook.
DRAINAGE AREA.--608 mi².
PERIOD OF RECORD.--March 1903 to September 1930, October 1943 to current year. Prior to October 1943, published as "near Plattsburgh".
REVISIONS HISTORY.--WSP 345: Drainage area. WSP 384: 1909-10 (monthly discharge only). WSP 1387: 1907-8. WSP 1437: 1908 (minimum daily only).
GAGE.--Water-stage recorder and crest-stage gage. Datum of gage is 155.74 ft above NGVD of 1929 and 155.40 ft above NAVD 0f 1988. Prior to Nov. 12, 1919, nonrecording gage, and Nov. 12, 1919 to Sept. 30, 1930, water-stage recorder, at site 1.5 mi upstream at different datum.
REMARKS.--Considerable diurnal fluctuation caused by power and industrial operations. Slight regulation by storage in Upper and Lower Saranac Lakes. The city of Plattsburgh diverts annually an average of less than 10 ft³/s from Saranac River and Mead and West Brooks, tributaries upstream from station, for municipal supply. About 1 ft³/s diverted from Great Chazy River basin into Saranac River for water supply of State Institutions at Dannemora.
Water Years 2014-24: Records good except those for estimated daily discharges, which are poor.
EXTREMES FOR PERIOD OF RECORD.--Maximum discharge, 14,400 ft³/s, Nov. 9, 1996, gage height, 12.11 ft; maximum gage height, 12.80 ft, Apr. 8, 1928, present datum, from floodmark on right bank 560 ft upstream from gage; minimum discharge not determined.
 WaterAlert – get an
email or text (SMS) alert based on your chosen threshold.
WaterAlert – get an
email or text (SMS) alert based on your chosen threshold.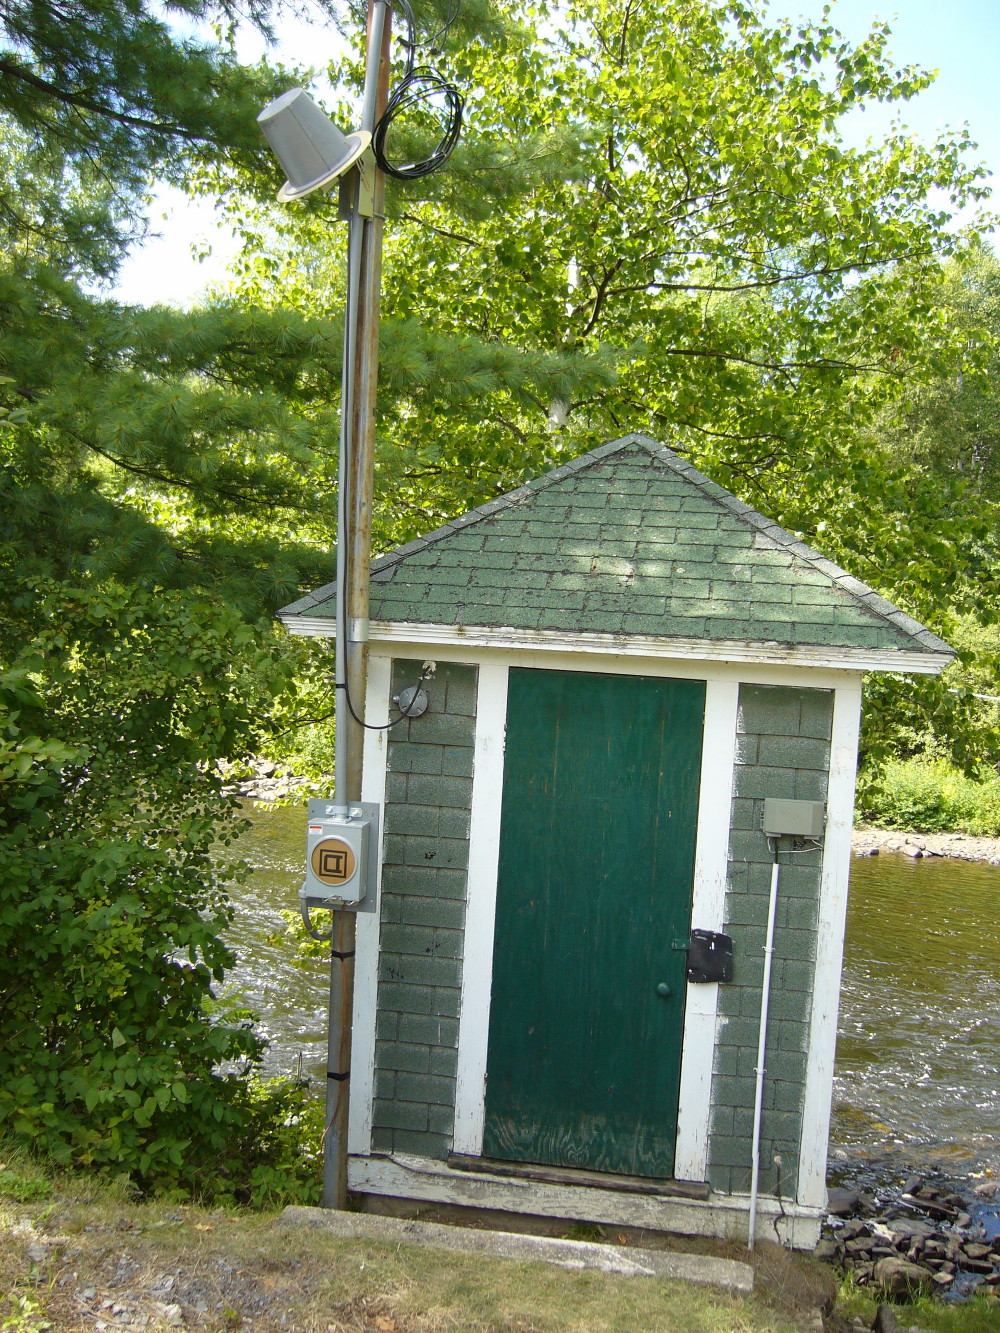 Station image
Summary of all available data for this site
Instantaneous-data availability statement

