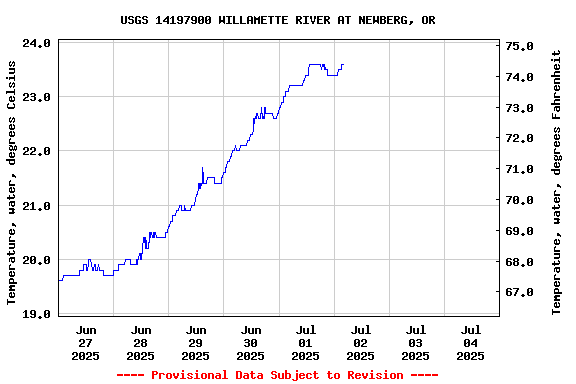
Most recent instantaneous value: 23.6 07-02-2025 04:15 PDT
See this graph on the Monitoring Location Pages
Station operated in cooperation with the city of Newberg.
NOTE: River forecasts and additional data can be obtained at the
National Weather Service's Advanced Hydrologic Prediction Services web page.
| Boating safety tips |
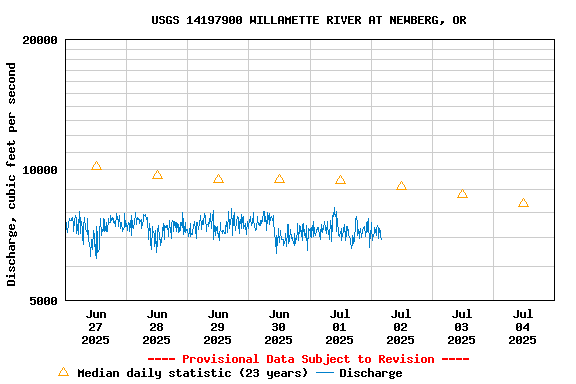
| Min (2015) | Most Recent Instantaneous Value Jul 4 | 25th percen- tile | Median | Mean | 75th percen- tile | Max (2022) |
|---|---|---|---|---|---|---|
| 5440 | 6900 | 7600 | 8350 | 9380 | 10100 | 15800 |
![]() U.S. Department of the Interior |
U.S. Geological Survey
U.S. Department of the Interior |
U.S. Geological Survey
Title: USGS Current Conditions for Oregon
URL:
Page Contact Information: Oregon Water Data Support Team
Page Last Modified: 2025-07-04 15:56:54 EDT
2.9 1.67 nadww02