USGS 01470755 Maiden Creek near Virginville, PA

PROVISIONAL DATA SUBJECT TO REVISION

Click to hidestation-specific text
Funding for this site is provided by:


Station gage imageSTATION.--01470755 MAIDEN CREEK NEAR VIRGINVILLE, PA
LOCATION.--Lat 40`31'31", long 75`52'31", Berks County, Hydrologic Unit, 02040203, on right bank, downstream side of State Route 143 bridge, at Virginville, PA.
DRAINAGE AREA.--157 square miles, includes that of Sacony Creek.
PERIOD OF RECORD.--March 2012 to current year.
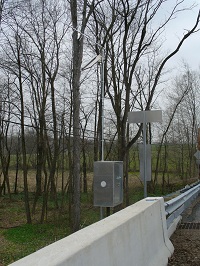
GAGE.--Water-stage recorder and crest-stage gage. Datum of gage is 308.0 ft above North American Vertical Datum of 1988. Satellite telemetry at station. Prior to November 8, 2022, the datum was erroneously reported as 440 ft above National Geodetic Vertical Datum of 1929.
COOPERATION.--Station established and maintained by the U.S. Geological Survey. Funding for the operation of this station is provided by the Reading Area Water Authority.
GAGE HEIGHTS OF IMPORTANCE.--
Supplied by USGS.-- Data transmitter operational limit - 23.7 ft.
This station managed by the PAWSC New Cumberland Office.

Available Parameters Available Period
  
2012-03-23  2024-04-19
2012-03-22  2024-04-19
2021-10-01  2024-04-19


 (7)
 

  -- or --


Summary of all available data for this site
Instantaneous-data availability statement


Discharge, cubic feet per second

Most recent instantaneous value: 235 04-19-2024   13:15 EDT
Graph of  Discharge, cubic feet per second

Add up to 2 more sites and replot for "Discharge, cubic feet per second"

?


Create presentation-quality / stand-alone graph.   Subscribe to WaterAlert      

See this graph on the Monitoring Location Pages


Daily discharge, cubic feet per second -- statistics for Apr 19 based on 12 water years of record more
Min
(2012)
25th
percen-
tile
Median Most Recent
Instantaneous
Value Apr 19
Mean 75th
percen-
tile
Max
(2022)
69.6 145 225 235 321 490 845


Gage height, feet

Most recent instantaneous value: 3.92 04-19-2024   13:15 EDT
Graph of  Gage height, feet

Add up to 2 more sites and replot for "Gage height, feet"

?


Create presentation-quality / stand-alone graph.   Subscribe to WaterAlert      

See this graph on the Monitoring Location Pages