PROVISIONAL DATA SUBJECT TO REVISION
Click to hidestation-specific text
Funding for this site is provided by:
 STATION.--01473900 Wissahickon Creek at Fort
Washington, PA
STATION.--01473900 Wissahickon Creek at Fort
Washington, PALOCATION.--Lat 40 07'26", long 75 13'13", Montgomery County, Hydrologic unit 02040203, on left bank of downstream side of bridge on State Highway 73, 0.5 mi downstream from Sandy Run, and 1 mi south of Fort Washington.
DRAINAGE AREA.--40.8 square miles.
PERIOD OF RECORD.--June 2000 to current year. September 1961 to March 1969; Annual maximum October 1969 to September 1979, at site and datum then in use.
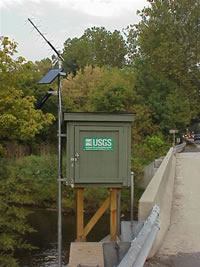
GAGE.--Water-stage recorder and water-quality monitor. Datum of gage is 139.98 ft above National Geodetic Vertical Datum of 1929. From September 1961 to March 1969, gage at present site, at datum 140.70 ft above National Geodetic Vertical Datum of 1929. Satellite telemetry at station.
COOPERATION.--Funding for the operation of this station is provided by the Delaware River Basin Commission and the City of Philadelphia, Water Department.
REMARKS.-- Calibration of water-quality instrumentation is conducted exclusively by Philadelphia Water Department personnel with USGS oversight. Erroneous or missing data, resulting from instrument malfunction, are not the responsibility of USGS. Regulation is unknown; possible minor pumping and withdrawals upstream, probably from treatment facilities or water intakes. The continuous water-quality monitor operated by the Philadelphia Water Department is located at Lat 40`07'26.1", Long 75`13`07.1", approximately 350 feet upstream of gage.
GAGE HEIGHTS OF IMPORTANCE.-
Supplied by USGS: Data transmitter operational limit - 17.9 ft, at 12.9 ft, road overflow begins.
Supplied by NWS: No flood stage has been determined for this station.
Summary of all available data for this site
Instantaneous-data availability statement