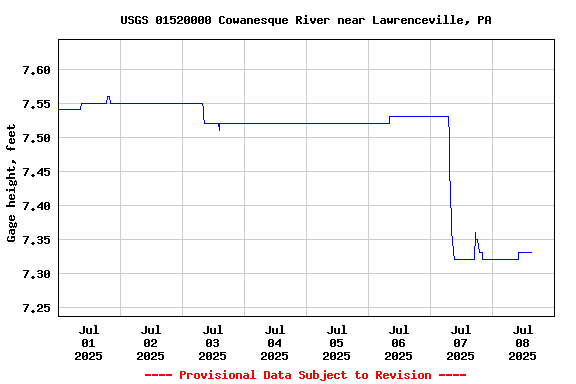
PROVISIONAL DATA SUBJECT TO REVISION
Click to hidestation-specific text
 STATION.--01520000 COWANESQUE RIVER NEAR
LAWRENCEVILLE, PA
STATION.--01520000 COWANESQUE RIVER NEAR
LAWRENCEVILLE, PALOCATION.--Lat 4l`59'48", long 77`08'25", Tioga County, Hydrologic Unit 02050104, on left bank on SR 4022, 0.5 mi downstream from Cowanesque Dam, 0.8 mi upstream from highway bridge on U.S. Route 15 in Lawrenceville, and 1.4 mi upstream from mouth.
DRAINAGE AREA.--298 square miles.
PERIOD OF RECORD.--June 1951 to current year. Prior to October 1951 monthly discharge only, published in WSP 1722.
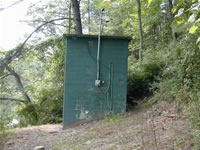
GAGE.--Water-stage recorder and water-quality monitor. Datum of gage is 983.6 ft above North American Vertical Datum of 1988. Prior to July 1976 at site 1.1 mi upstream at datum 14.07 ft higher. Prior to October 2, 2023, the datum of gage was reported as 983.96 ft. above National Geodetic Vertical Datum of 1929. Satellite and landline telemetry at station.
COOPERATION.--Station established and maintained by the U.S. Geological Survey. Funding for the operation of this station is provided by the U.S. Army Corps of Engineers, Baltimore District, the Pennsylvania Department of Environmental Protection, and the U.S. Geological Survey.
REMARKS.--Flow regulated since December 1979 by Cowanesque Dam (station 01519995).
GAGE HEIGHTS OF IMPORTANCE.--
Supplied by USGS: Maximum recordable gage height (stage sensor operational limit) - 24.5 ft; Data transmitter operational limit - 25.9 ft;
Supplied by NWS: Action stage-11 ft; Flood stage-13 ft, the right or south bank overflows near town affecting homes in low lying areas; Moderate flood stage-14 ft, several homes flooded on the right or south bank; Major flood stage-17 ft, Widespread flooding on right or south bank. Most of Lawrenceville will be evacuated.
Summary of all available data for this site
Instantaneous-data availability statement