USGS 01531908 Towanda Creek near Franklindale, PA

PROVISIONAL DATA SUBJECT TO REVISION

Click to hidestation-specific text
Funding for this site is provided by:


Station gage imageSTATION.--01531908 TOWANDA CREEK NEAR FRANKLINDALE,
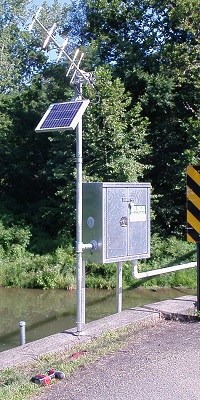
 PA
LOCATION.--Lat 41`41'52", long 76`34'43", Bradford County, Hydrologic Unit 02050106, located upstream right wingwall of steel grate truss bridge near Franklin Township Volunteer Fire Department
DRAINAGE AREA.--112 square miles.
PERIOD OF RECORD.--July 2010 to current year.
GAGE.--Water-stage recorder and crest-stage gage. Datum of gage is 892.9 ft above North American Vertical Datum of 1988 (GNSS survey). Prior to February 19, 2025, the datum of gage was erroneously reported as 900 ft above National Geodetic Vertical Datum of 1929. Satellite telemetry at station.
COOPERATION.--Station established and maintained by the U.S. Geological Survey. Funding for the operation of this station is provided by Repsol Oil & Gas USA, LLC.
This station managed by the PAWSC Williamsport Field Office.

Available Parameters Available Period
  
2010-07-31  2025-07-03
2010-07-30  2025-07-03
2021-10-01  2025-07-03


 (7)
 

  -- or --


Summary of all available data for this site
Instantaneous-data availability statement


Discharge, cubic feet per second

Most recent instantaneous value: 31.6 07-03-2025   01:15 EDT
Graph of  Discharge, cubic feet per second

Add up to 2 more sites and replot for "Discharge, cubic feet per second"

?


Create presentation-quality / stand-alone graph.   Subscribe to WaterAlert      

See this graph on the Monitoring Location Pages


Daily discharge, cubic feet per second -- statistics for Jul 3 based on 14 water years of record more
Min
(2016)
25th
percen-
tile
Median Most Recent
Instantaneous
Value Jul 3
Mean 75th
percen-
tile
Max
(2013)
6.72 13 24 31.6 63 104 330


Gage height, feet

Most recent instantaneous value: 3.26 07-03-2025   01:15 EDT
Graph of  Gage height, feet

Add up to 2 more sites and replot for "Gage height, feet"

?


Create presentation-quality / stand-alone graph.   Subscribe to WaterAlert      

See this graph on the Monitoring Location Pages