PROVISIONAL DATA SUBJECT TO REVISION
Click to hidestation-specific text
Funding for this site is provided by:
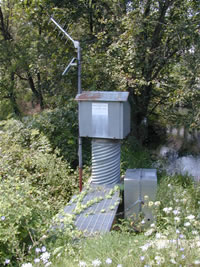 STATION.--01546400 SPRING CREEK AT HOUSERVILLE,
PA
STATION.--01546400 SPRING CREEK AT HOUSERVILLE,
PALOCATION.--Lat 40`50'01", long 77`49'40", Centre County, Hydrologic Unit 02050204, on right bank 15 ft upstream from bridge on Township Route 365, 0.7 mi north of Houserville, 1.3 mi downstream from Slab Cabin Run, and 3.3 mi northeast of State College.
DRAINAGE AREA.--58.5 square miles.
PERIOD OF RECORD.--November 1984 to current year.
GAGE.--Water-stage recorder and crest-stage gage. Datum of gage is 925.96 ft above North American Vertical Datum of 1988. Prior to September 1, 2023, datum of gage was reported as 926.63 ft above National Geodetic Vertical Datum of 1929. Satellite telemetry at station.
COOPERATION.--Station established and maintained by the U. S. Geological Survey. Funding for the operation of the this station is provided by the Clearwater Conservancy.
GAGE HEIGHTS OF IMPORTANCE.-
Supplied by USGS: Maximum recordable gage height (stage sensor operational limit) - 10.9 ft; Data transmitter operational limit - 12.3 ft;
Supplied by NWS: Action stage-5 ft.
STREAM CHANNEL IS CURRENTLY UNDERGOING RESTORATION EFFORTS. GAGE HEIGHTS WILL REFLECT THESE CHANGES IMMEDIATELY; DISCHARGE WILL BE COMPUTED AND ADJUSTED AS ADDITIONAL FIELD INFORMATION IS COLLECTED.
Summary of all available data for this site
Instantaneous-data availability statement

