PROVISIONAL DATA SUBJECT TO REVISION
Click to hidestation-specific text
Funding for this site is provided by:
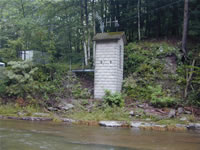 STATION.--01552500 MUNCY CREEK NEAR SONESTOWN,
PA
STATION.--01552500 MUNCY CREEK NEAR SONESTOWN,
PALOCATION.--Lat 41`21'25", long 76`32'06", Sullivan County, Hydrologic Unit 02050206, on right bank 150 ft downstream from Slip Run, 185 ft downstream from bridge on SR 2002, and 1.2 mi east of Sonestown.
DRAINAGE AREA.--23.8 square miles.
PERIOD OF RECORD.--October 1940 to current year.
GAGE.--Water-stage recorder and crest-stage gage. Datum of gage is 1,024.50 ft above North American Vertical Datum of 1988 (from benchmark). Prior to Mar. 31, 1941, non-recording gage at same site and datum. Prior to June 5, 2025, the datum of gage was reported as 1,025.01 ft above National Geodetic Vertical Datum of 1929. Satellite telemetry at station.
COOPERATION.--Funding for the operation of this station is provided by the Pennsylvania Department of Environmental Protection and the U.S. Geological Survey.
GAGE HEIGHTS OF IMPORTANCE.-
Supplied by USGS: Data transmitter operational limit - 17.9 ft;
Supplied by NWS: Action stage-5 ft.
Summary of all available data for this site
Instantaneous-data availability statement

