USGS 01573660 Fishing Creek at Goldsboro, PA

PROVISIONAL DATA SUBJECT TO REVISION

Click to hidestation-specific text
Funding for this site is provided by:


Station gage imageSTATION.--01573660 FISHING CREEK AT GOLDSBORO,
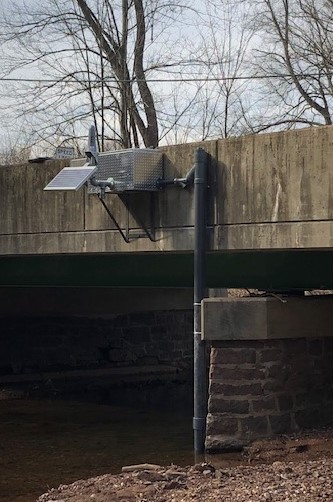
 PA
LOCATION.--Lat 40`09'12", long 76`45'20", York County, Hydrologic Unit 02050305, on downstream side of concrete bridge at intersection of PA Rt 262 and Pine Road, 0.75 mi upstream from mouth, and 0.25 mi west of Goldsboro.
DRAINAGE AREA.--17.5 square miles.
PERIOD OF RECORD.--March 2020 to current year.
GAGE.--Water-stage recorder, crest-stage gage, and water-quality monitor. Datum of gage is 300 ft above North American Vertical Datum of 1988, from topographic map. Satellite telemetry at station.
COOPERATION.--Station established and maintained by the U.S. Geological Survey in cooperation with the County of York.
REMARKS.--
Supplied by USGS-- Data transmitter operational limit - 12.5 ft.
This station managed by the PAWSC New Cumberland Office.

Available Parameters Available Period
  
2020-03-03  2024-04-18
2020-03-02  2024-04-18
2020-03-02  2024-04-18
2020-03-03  2024-04-18
2020-03-03  2024-04-18
2020-03-03  2024-04-18
2020-03-03  2024-04-18
2021-04-19  2024-04-18
2020-03-03  2024-04-18
2021-04-19  2024-04-18
2021-04-19  2024-04-18
2021-04-19  2024-04-18


 (7)
 

  -- or --


Summary of all available data for this site
Instantaneous-data availability statement


Temperature, water, degrees Celsius

Most recent instantaneous value: 14.4 04-18-2024   23:00 EDT
Graph of  Temperature, water, degrees Celsius

Add up to 2 more sites and replot for "Temperature, water, degrees Celsius"

?


Create presentation-quality / stand-alone graph.   Subscribe to WaterAlert      

See this graph on the Monitoring Location Pages


Discharge, cubic feet per second

Most recent instantaneous value: 21.3 04-18-2024   23:00 EDT
Graph of  Discharge, cubic feet per second

Add up to 2 more sites and replot for "Discharge, cubic feet per second"

?


Create presentation-quality / stand-alone graph.   Subscribe to WaterAlert      

See this graph on the Monitoring Location Pages


Daily discharge, cubic feet per second -- statistics for Apr 18 based on 4 water years of record more
Min
(2023)
25th
percen-
tile
Mean Most Recent
Instantaneous
Value Apr 18
Median 75th
percen-
tile
Max
(2020)
7.86 10 21 21.3 23 30 31.5


Gage height, feet

Most recent instantaneous value: 2.49 04-18-2024   23:00 EDT
Graph of  Gage height, feet

Add up to 2 more sites and replot for "Gage height, feet"

?


Create presentation-quality / stand-alone graph.   Subscribe to WaterAlert      

See this graph on the Monitoring Location Pages