USGS 01576007 Kreutz Creek at Strickler, PA

PROVISIONAL DATA SUBJECT TO REVISION

Click to hidestation-specific text
Funding for this site is provided by:


Station gage image
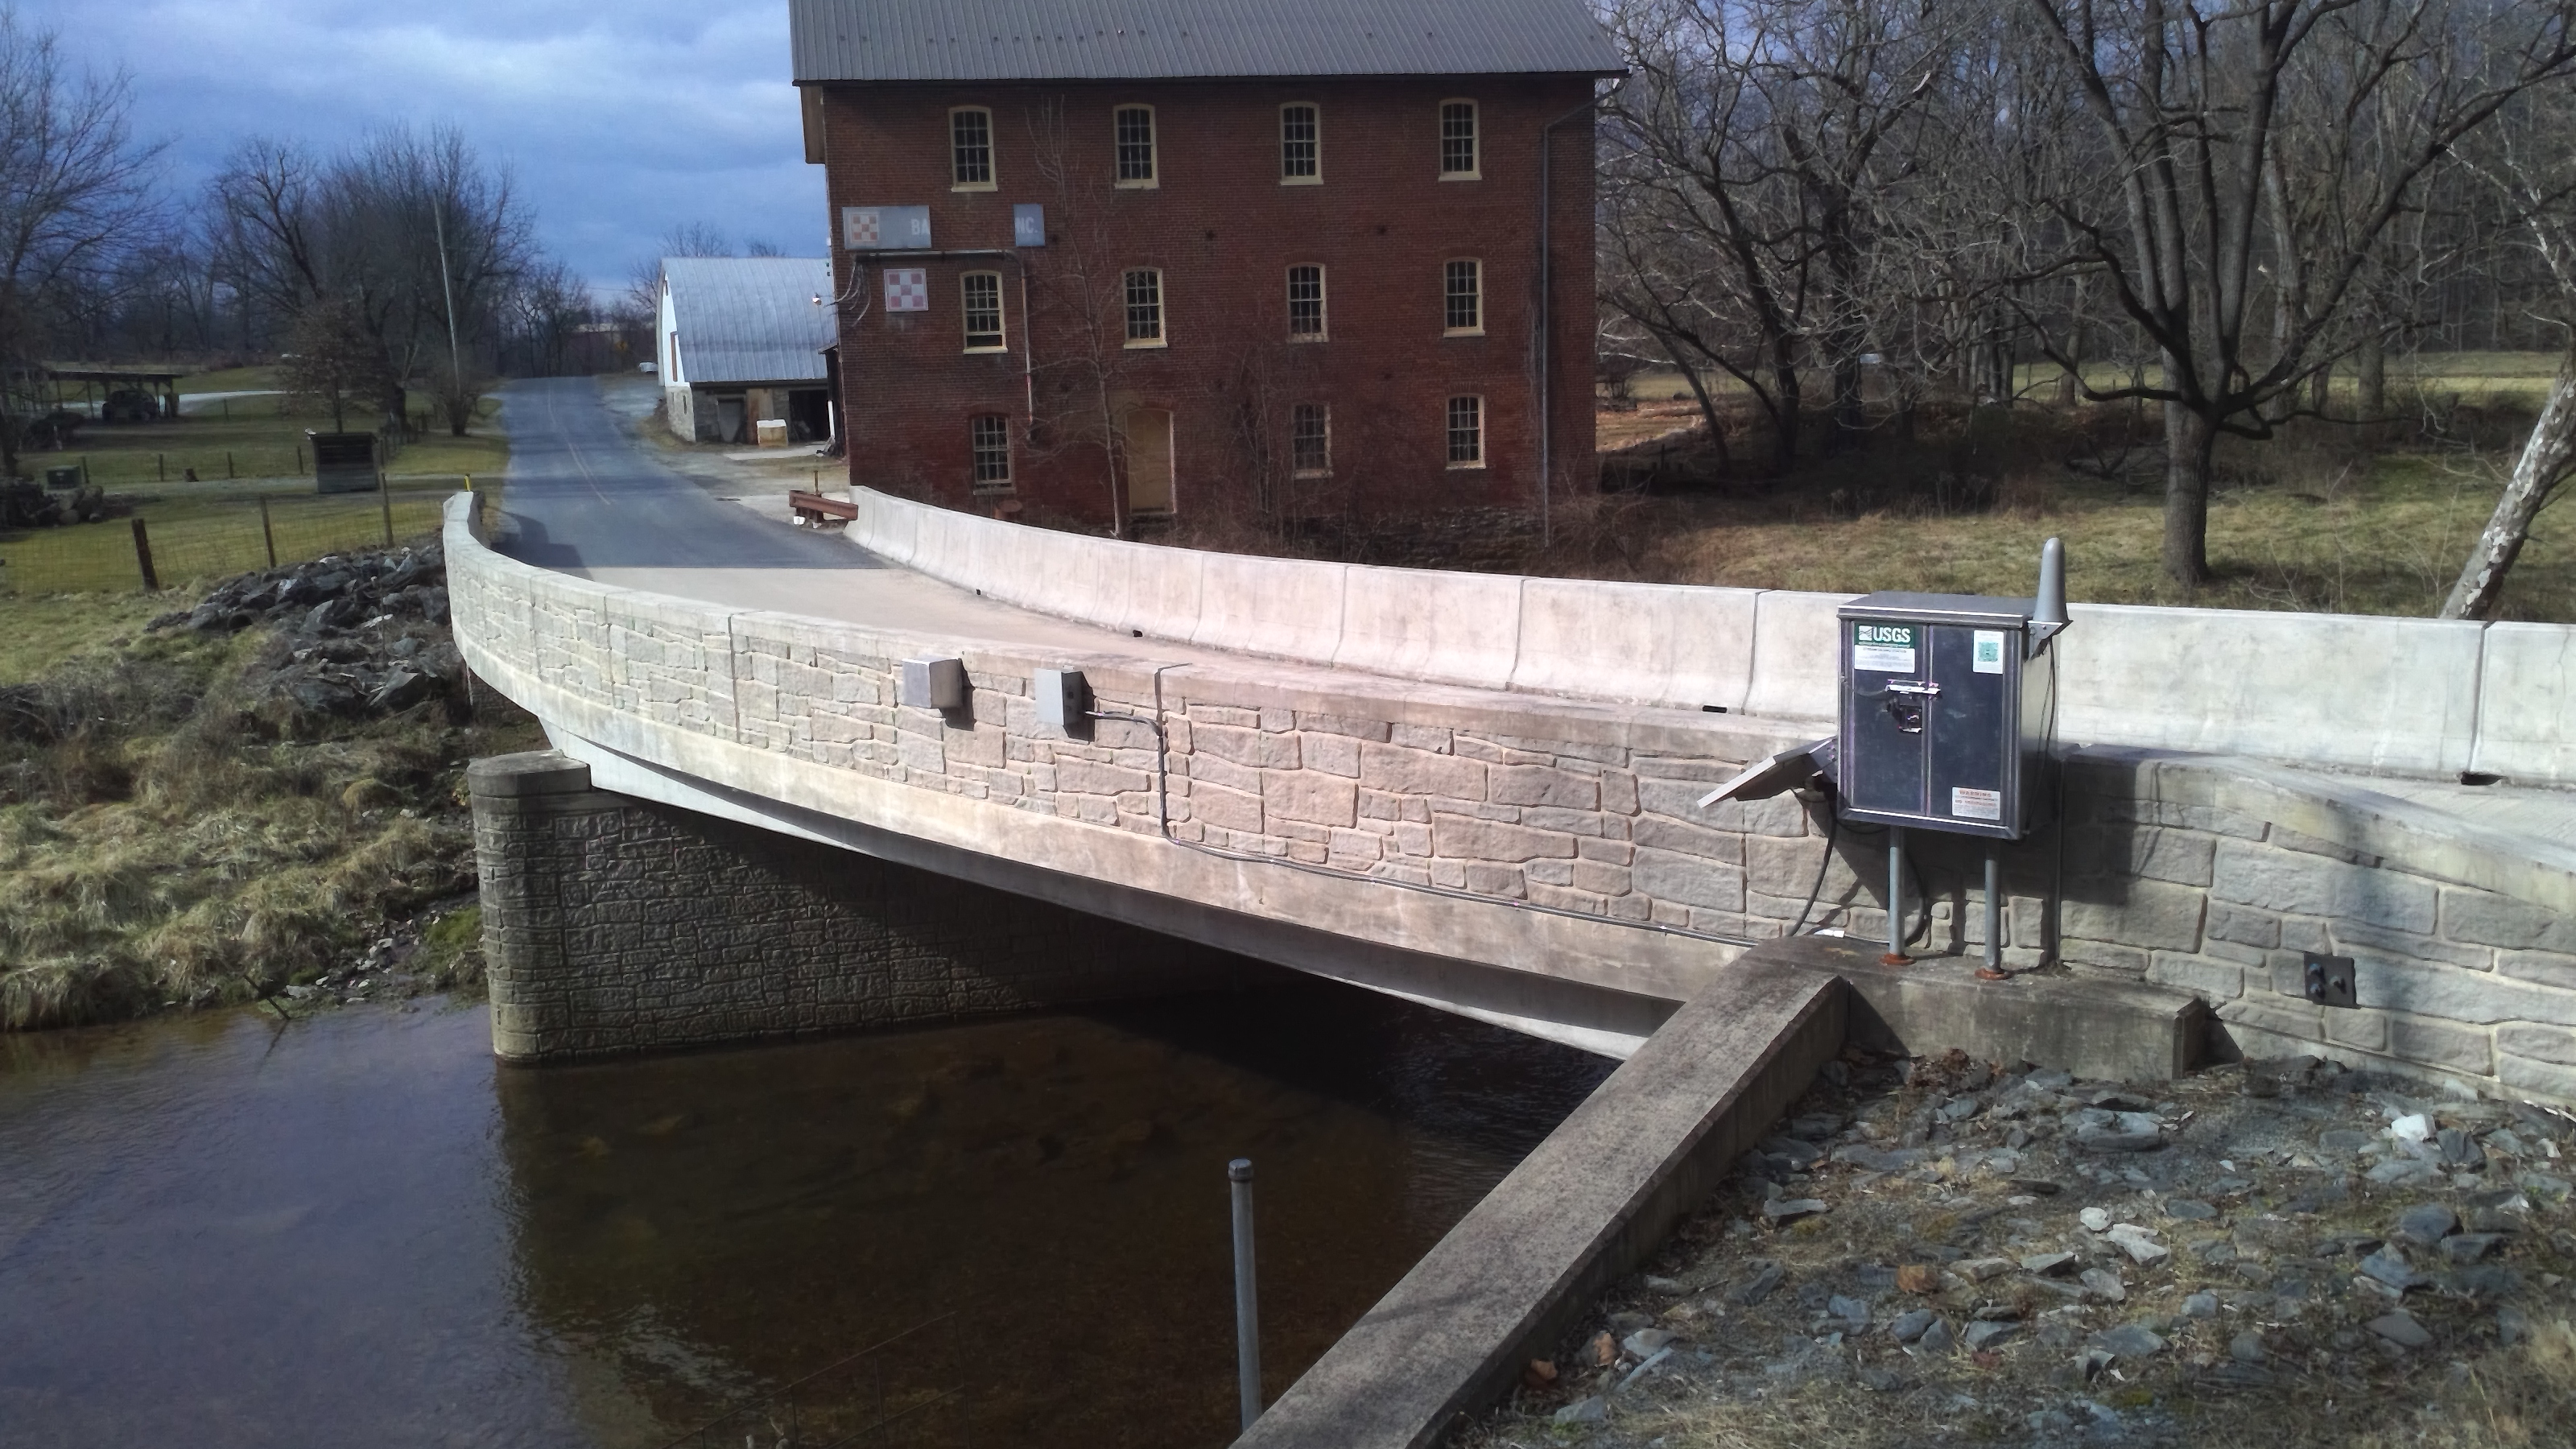
STATION.--01576007 KREUTZ CREEK AT STRICKLER, PA
LOCATION.--Lat 40`00'51", long 76`32'53", York County, Hydrologic Unit, 02050306, on left bank, downstream side of Bairs Mill Road bridge, 0.5 mi south of PA Rt 462, 1.3 mi southwest of Wrightsville.
DRAINAGE AREA.--32.3 square miles.
PERIOD OF RECORD.--March 2020 to current year.
GAGE.--Water-stage recorder, crest-stage gage, and water-quality monitor. Datum of gage is 260 ft above North American Vertical Datum of 1988, from topographic map. Satellite telemetry at station.
COOPERATION.--Station established and maintained by the U.S. Geological Survey in cooperation with the County of York.
REMARKS.--
Supplied by USGS-- Data transmitter operational limit - xx.xx ft.
This station managed by the PAWSC New Cumberland Office.

Available Parameters Available Period
  
2020-03-03  2024-04-24
2020-03-03  2024-04-24
2020-03-03  2024-04-24
2020-03-03  2024-04-24
2020-03-03  2024-04-24
2020-03-03  2024-04-24
2020-03-03  2024-04-24
2021-04-25  2024-04-24
2020-05-12  2024-04-24
2021-04-25  2024-04-24
2021-04-25  2024-04-24
2021-05-03  2024-04-24


 (7)
 

  -- or --


Summary of all available data for this site
Instantaneous-data availability statement


Temperature, water, degrees Celsius

Most recent instantaneous value: 14.6 04-24-2024   18:15 EDT
Graph of  Temperature, water, degrees Celsius

Add up to 2 more sites and replot for "Temperature, water, degrees Celsius"

?


Create presentation-quality / stand-alone graph.   Subscribe to WaterAlert      

See this graph on the Monitoring Location Pages


Discharge, cubic feet per second

Most recent instantaneous value: 44.0 04-24-2024   18:15 EDT
Graph of  Discharge, cubic feet per second

Add up to 2 more sites and replot for "Discharge, cubic feet per second"

?


Create presentation-quality / stand-alone graph.   Subscribe to WaterAlert      

See this graph on the Monitoring Location Pages


Daily discharge, cubic feet per second -- statistics for Apr 24 based on 4 water years of record more
Min
(2023)
25th
percen-
tile
Median Mean Most Recent
Instantaneous
Value Apr 24
75th
percen-
tile
Max
(2020)
21.7 23 33 38 44.0 59 66.5


Gage height, feet

Most recent instantaneous value: 1.96 04-24-2024   18:15 EDT
Graph of  Gage height, feet

Add up to 2 more sites and replot for "Gage height, feet"

?


Create presentation-quality / stand-alone graph.   Subscribe to WaterAlert      

See this graph on the Monitoring Location Pages