USGS 01480675 Marsh Creek near Glenmoore, PA

PROVISIONAL DATA SUBJECT TO REVISION

Click to hidestation-specific text


Station gage image
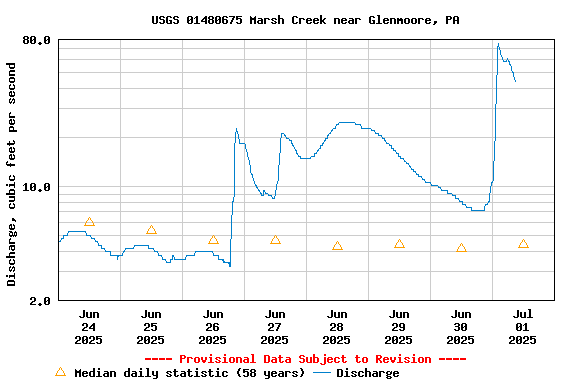
STATION.--01480675 MARSH CREEK NEAR GLENMOORE, PA
LOCATION.--Lat 40`05'52", long 75`44'31", Chester County, Hydrologic Unit 02040205, on left bank 200 ft north of Pennsylvania Turnpike, 1.2 mi downstream from Lyons Run, 1.8 mi upstream from Black Horse Creek, and 3.0 mi northeast of Glenmoore.
DRAINAGE AREA.--8.57 square miles.
PERIOD OF RECORD.--July 1966 to current year.
GAGE.--Water-stage recorder, crest-stage gage, and concrete control. Datum of gage is 445.4 ft. above North American Vertical Datum of 1988 (GNSS survey). Prior to February 19, 2025, the datum of gage was erroneously reported as 450 ft above National Geodetic Vertical Datum of 1929. Satellite and landline telemetry at station.
COOPERATION.--Funding for the operation of this station is provided by the Pennsylvania Department of Environmental Protection and the U.S. Geological Survey.
GAGE HEIGHTS OF IMPORTANCE.-
Supplied by USGS: Maximum recordable gage height (stage sensor operational limit) - 9.3 ft; Data transmitter operational limit - 9.7 ft;
Supplied by NWS: No flood stage has been determined for this station.
This station managed by the PAWSC Downingtown Field Office.

Available Parameters Available Period
  
1990-10-01  2025-07-01
2007-10-01  2025-07-01
2022-07-01  2025-07-01


 (7)
 

  -- or --


Summary of all available data for this site
Instantaneous-data availability statement


Discharge, cubic feet per second

Most recent instantaneous value: 70.2 07-01-2025   02:45 EDT
Graph of  Discharge, cubic feet per second

Add up to 2 more sites and replot for "Discharge, cubic feet per second"

?


Create presentation-quality / stand-alone graph.   Subscribe to WaterAlert      

See this graph on the Monitoring Location Pages


Daily discharge, cubic feet per second -- statistics for Jul 1 based on 58 water years of record more
Min
(1999)
25th
percen-
tile
Median 75th
percen-
tile
Mean Most Recent
Instantaneous
Value Jul 1
Max
(1984)
1.40 3 4.4 8.2 11 70.2 175


Gage height, feet

Most recent instantaneous value: 2.10 07-01-2025   02:45 EDT
Graph of  Gage height, feet

Add up to 2 more sites and replot for "Gage height, feet"

?


Create presentation-quality / stand-alone graph.   Subscribe to WaterAlert      

See this graph on the Monitoring Location Pages


Stream water level elevation above NAVD 1988, in feet

Most recent instantaneous value: 447.50 07-01-2025   02:45 EDT
Graph of  Stream water level elevation above NAVD 1988, in feet

Add up to 2 more sites and replot for "Stream water level elevation above NAVD 1988, in feet"

?


Create presentation-quality / stand-alone graph.   Subscribe to WaterAlert      

See this graph on the Monitoring Location Pages