USGS 01543693 East Fork Sinnemahoning at Wharton Township, PA

PROVISIONAL DATA SUBJECT TO REVISION

Click to hidestation-specific text


Station gage image
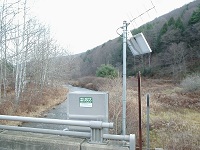
STATION.--01543693 EAST FORK SINNEMAHONING CREEK AT WHARTON TOWNSHIP, PA
LOCATION.--Lat 41`32'29", long 77`58'49", Potter County, Hydrologic Unit 02050202, on left bank on upstream side of bridge on State Route 3001, 2.5 miles upstream from mouth.
DRAINAGE AREA.--49.2 square miles.
PERIOD OF RECORD.--October 2010 to current year.
GAGE.--Water-stage recorder and crest-stage gage. Datum of gage is 1,155.07 ft above North American Vertical Datum of 1988 (from benchmark). Prior to February 19, 2025, the datum of gage was erroneously reported as 1,170 ft above National Geodetic Vertical Datum of 1929. Satellite telemetry at station.
COOPERATION.--Station established and maintained by the U.S. Geological Survey. Funding for this station is provided by the Pennsylvania Department of Environmental Protection.
FLOOD STAGE.--No flood stage has been determined for this station.
This station managed by the PAWSC Williamsport Field Office.

Available Parameters Available Period
  
2010-10-28  2025-07-04
2010-10-27  2025-07-04
2021-10-01  2025-07-04


 (7)
 

  -- or --


Summary of all available data for this site
Instantaneous-data availability statement


Discharge, cubic feet per second

Most recent instantaneous value: 25.5 07-04-2025   18:00 EDT
Graph of  Discharge, cubic feet per second

Add up to 2 more sites and replot for "Discharge, cubic feet per second"

?


Create presentation-quality / stand-alone graph.   Subscribe to WaterAlert      

See this graph on the Monitoring Location Pages


Daily discharge, cubic feet per second -- statistics for Jul 4 based on 14 water years of record more
Min
(2011)
25th
percen-
tile
Median Most Recent
Instantaneous
Value Jul 4
Mean 75th
percen-
tile
Max
(2015)
5.52 7 18 25.5 33 43 137


Gage height, feet

Most recent instantaneous value: 3.60 07-04-2025   18:00 EDT
Graph of  Gage height, feet

Add up to 2 more sites and replot for "Gage height, feet"

?


Create presentation-quality / stand-alone graph.   Subscribe to WaterAlert      

See this graph on the Monitoring Location Pages


Stream water level elevation above NAVD 1988, in feet

Most recent instantaneous value: 1158.67 07-04-2025   18:00 EDT
Graph of  Stream water level elevation above NAVD 1988, in feet

Add up to 2 more sites and replot for "Stream water level elevation above NAVD 1988, in feet"

?


Create presentation-quality / stand-alone graph.   Subscribe to WaterAlert      

See this graph on the Monitoring Location Pages