USGS 01573825 West Conewago Creek at East Berlin, PA

PROVISIONAL DATA SUBJECT TO REVISION

Click to hidestation-specific text


Station gage image
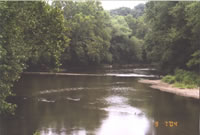
STATION.--01573825 WEST CONEWAGO CREEK AT EAST BERLIN, PA
LOCATION.--Lat 39`56'28.4", long 76`59'24", Adams County, Hydrologic Unit 02050306, on right bank 30 ft downstream from bridge on State Highway 234, 1.4 mi upstream from confluence with Beaver Creek, at East Berlin.
DRAINAGE AREA.--218 square miles.
PERIOD OF RECORD.--September 2003 to current year.
GAGE.--Water-stage recorder and crest-stage gage and concrete control. Datum of gage is 385.7 ft above North American Vertical Datum of 1988 (GNSS survey). Prior to April 3, 2025, the datum of gage was erroneously reported as 400 ft above National Geodetic Vertical Datum of 1929. Satellite telemetry at station.
COOPERATION.--Funding for the operation of this station is provided by the Pennsylvania Department of Environmental Protection.
REMARKS.--Satellite telemetry at station. Regulations and diversions are Conewago Creek on Beaver Creek.
GAGE HEIGHTS OF IMPORTANCE.-
Supplied by USGS: Data transmitter operational limit - 19.9 ft;
Supplied by NWS: No flood stage has been determined for this station.
This station managed by the PAWSC New Cumberland Office.

Available Parameters Available Period
  
2003-09-12  2025-07-04
2007-10-01  2025-07-04
2022-07-05  2025-07-04


 (7)
 

  -- or --


Summary of all available data for this site
Instantaneous-data availability statement


Discharge, cubic feet per second

Most recent instantaneous value: 197 07-04-2025   11:45 EDT
Graph of  Discharge, cubic feet per second

Add up to 2 more sites and replot for "Discharge, cubic feet per second"

?


Create presentation-quality / stand-alone graph.   Subscribe to WaterAlert      

See this graph on the Monitoring Location Pages


Daily discharge, cubic feet per second -- statistics for Jul 4 based on 21 water years of record more
Min
(2010)
25th
percen-
tile
Median Mean 75th
percen-
tile
Most Recent
Instantaneous
Value Jul 4
Max
(2015)
23.8 41 65 88 97 197 345


Gage height, feet

Most recent instantaneous value: 3.42 07-04-2025   11:45 EDT
Graph of  Gage height, feet

Add up to 2 more sites and replot for "Gage height, feet"

?


Create presentation-quality / stand-alone graph.   Subscribe to WaterAlert      

See this graph on the Monitoring Location Pages


Stream water level elevation above NAVD 1988, in feet

Most recent instantaneous value: 389.12 07-04-2025   11:45 EDT
Graph of  Stream water level elevation above NAVD 1988, in feet

Add up to 2 more sites and replot for "Stream water level elevation above NAVD 1988, in feet"

?


Create presentation-quality / stand-alone graph.   Subscribe to WaterAlert      

See this graph on the Monitoring Location Pages